Creating drivetime contours with Copy objects
The copy objects command, found on the objects menu, can be used to copy objects to a new layer.
One use of the copy objects command is to create a layer of a different type, such as an area layer of concentric rings (the classic 1-3-5-mile ring, for example), or a layer based on drive times from a given point.
In this example sequence, we will start with a point layer, then copy the layer to a 10-minute drivetime layer, and then to a 1-3-5-mile ring layer. We will give the ring layer a customized font and symbol appearance, and look at the data for the drivetimes and the ring.
Let's begin by creating a point layer within a fairly small study area, near Portland Oregon.
First, make sure you are in Select Mode
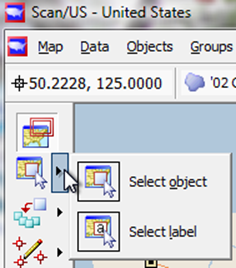
Select mode, 'select object' submode
Click on Portland in the map. A choice tree will pop up in the map.
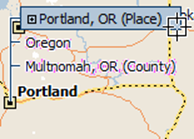
Select an object at a point: Object selection 'tree'.
Select Portland and it will be highlighted with a circle around it in the map.
Now, from the map menu choose "New Study Area..." The New Study Area dialog will appear.
Click the "Create" button to create a new study area centered on Portland Oregon.
We will create a point layer with two locations: one in Beaverton and one on the right side of the map, to the north of Happy Valley. One way to do this: from the Objects menu choose Create Layer: Locations. The "Create Layer Locations" dialog will appear and you can enter a name for your new layer. Enter the name "Portland Candidate Sites", and click the OK button.
Now, anywhere you click in the map, a new location will be created. First click in Beaverton near where routes 8 and 10 intersect. The Location Properties dialog will appear. Enter the name "Beaverton Site" and click "Create". Now click on an intersection north of Happy Valley. Enter the name Happy Valley Site and click "Create".
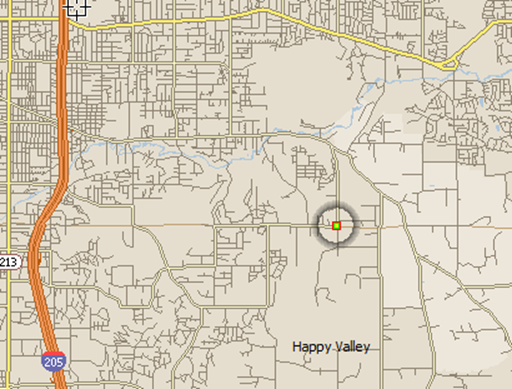
In 'location' mode, click to create new locations
From the Map menu choose "Save Study Area" and click OK
Now that we have two locations in the map, let's use the "zoom to top" button to be able to see the map little better. On the left side of the map click the blue upward-pointing arrow button at the top right of the Zoom slider.
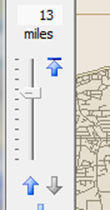
Zoom slider zooms map in and out
The map will zoom out and the zoom slider will show a maximum size for the study area.
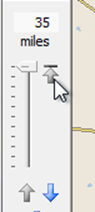
Zoom slider after clicking 'zoom to top' button
Now you'll be able to see a larger area when we do the "Copy Objects" operation.
Copy objects
From the Objects menu choose "Copy Objects".
The dialog box "Copy Objects To Layer" will appear, showing as the source layer to layer you created: Portland Candidate Sites. You will see two columns underneath the source layer specification: "choose from active layer" on the left and "choose from layer roster" on the right. The layer roster contains all the locations in the layer, even locations that may not be shown within this study area. Click selection circle next to all roster objects.
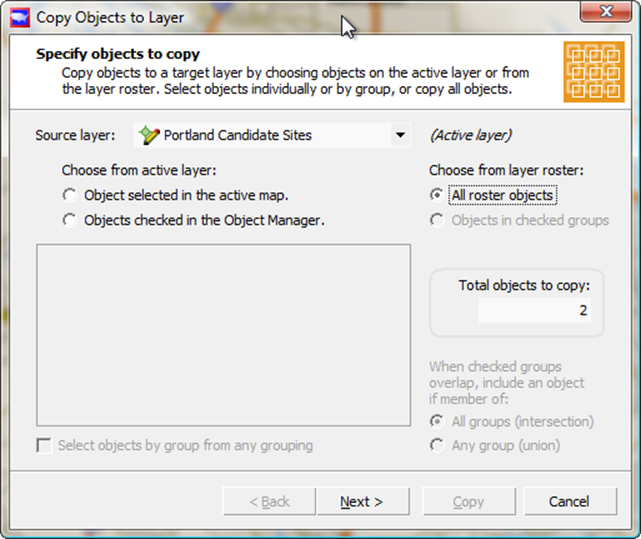
Copy Objects to Layer: All roster objects
Now click "Next":
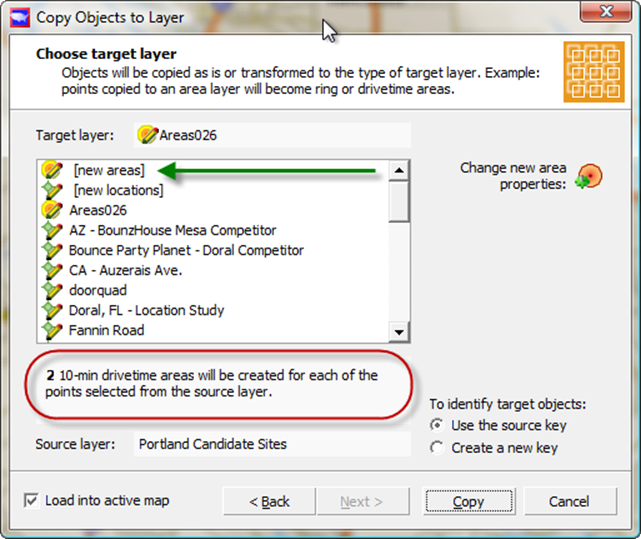
Choose 'new areas' as target layer to create drivetimes based on your points
At this point you can click the new areas choice (green arrow) in the list of possible target layers to which your two sites will be copied. A default action (red oval) may be shown below the list of target areas on your dialog. Here, the default action is: "two 10 minute drive time areas will be created for each of the points selected from the source layer". However, in your case, something else may be displayed.
If the action is what you desire and you can click the Copy button and perform the copy immediately.
However for the purpose of this example click "[new areas]" next to the green arrow. The dialog box Create Layer Areas will appear. Enter the name Portland Candidate Drive Times and beneath "new objects will be created as" click the drivetime tab.
To make concentric rings instead of drivetime contours, you will choose the Ringareas tab at this point, as we will do later in this example.
Where it says "enter up to 10 drive times, in minutes:" enter the number 10, in order to get 10 minute drive-times around each of the two points. Click the OK button. Now click copy. You will see two irregularly shaped drive-time polygons appear on the map.
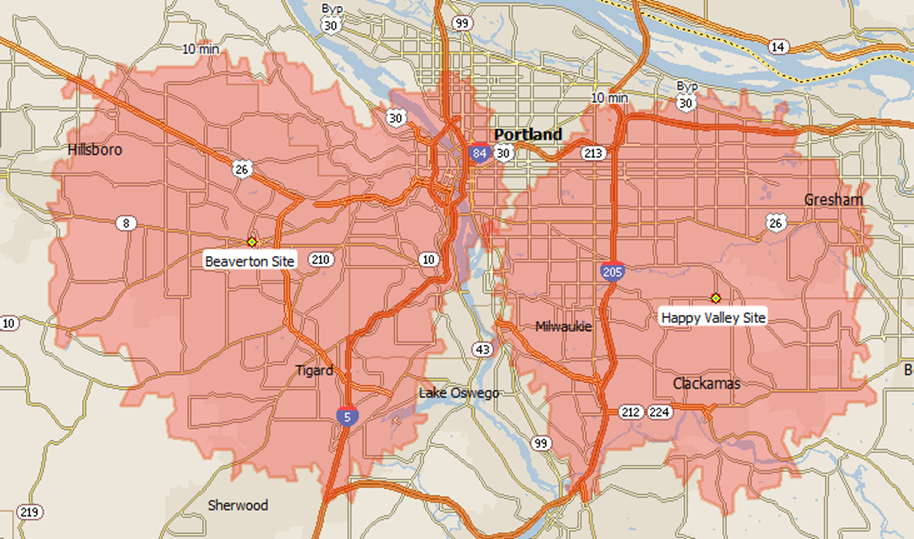
Drivetime contours around Beaverton and Happy Valley
Finally, from the map menu, choose Save Study Area.
Comparing demographics on created areas
From the data menu, choose Quicklook. Notice that the values displayed in the QuickLook dialog may not be demographic values. They are the object key, object name, and the latitude and longitude coordinates of the site. This is because the current data list is the Location Roster of your candidate sites.
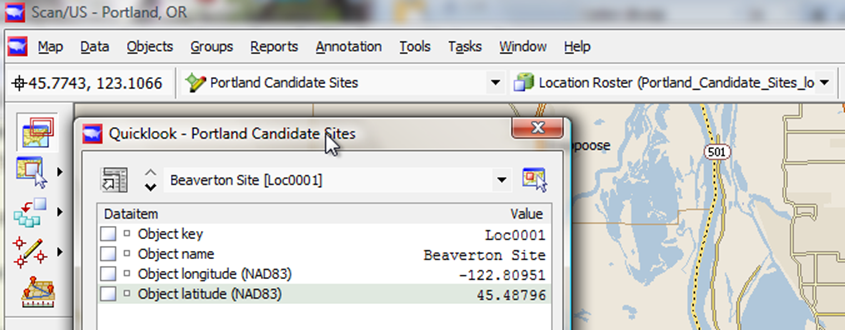
Quicklook showing: Layer roster of location file
Actually, it is not even the right layer!
It shows the Portland Candidate Sites layer, that you copied FROM, rather than one of the drivetime contours that you just created.
Use the layer drop-down shown directly above the Quicklook (above) to change from "Portland Candidate Sites" to "Portland Candidate Drive-times":

Quicklook showing: Layer roster of drivetimes layer
Now, click the database drop-down (red circle, above) to show the other databases on the layer:
To select one of the demographic databases click the active data list drop-down to see more possibilities.
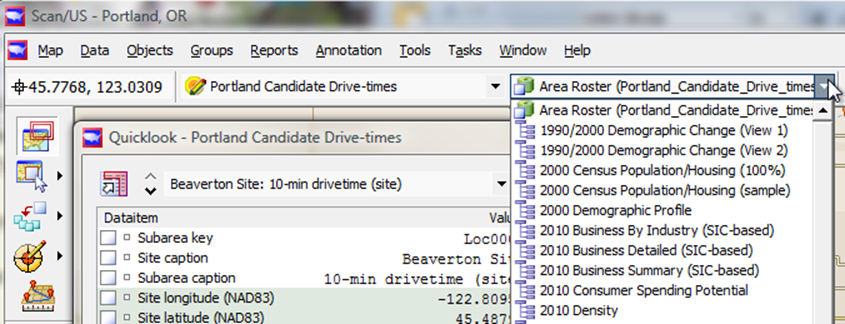
Changing active datalist (above right), to show demographics in Quicklook
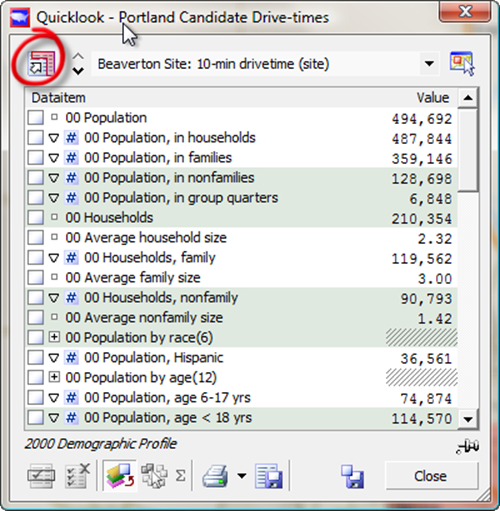
When you select a database, say for example the 2000 Demographic Profile, summaries for the drive time will appear in the Quicklook dialog.
'Show benchmarks' button (red circle above) expands Quicklook
Click the show benchmarks button next to the site name (red circle above), and the Compare Object icon in the Benchmark expansion (red circle at right below) in order to compare the demographics for the two drivetime areas.
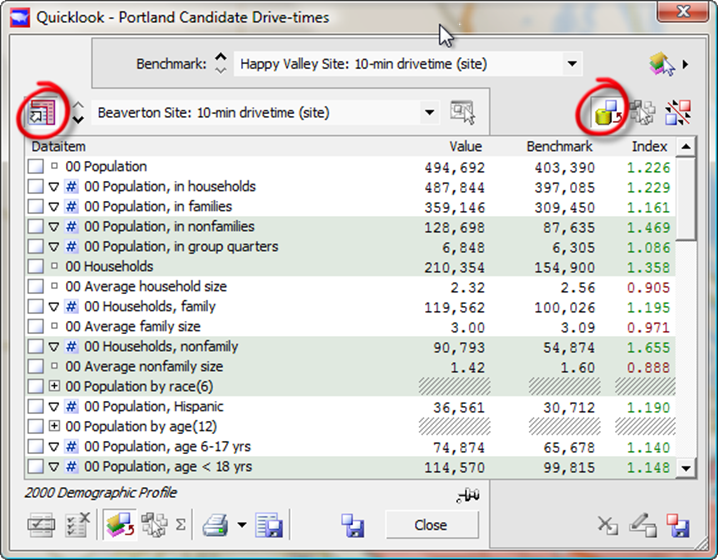
Quicklook expanded to compare demographics for two drive-time areas
Creating Ring Areas with Copy Objects
Now let's make a different kind of layer from our Portland Candidate Sites Layer. From the map menu choose Map Layers.
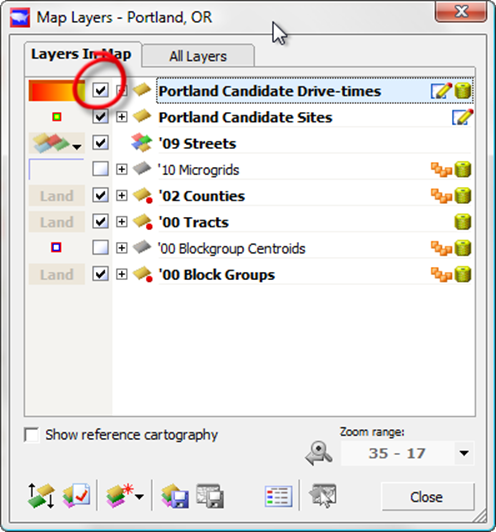
Click checkbox off (red circle above) to hide a layer
Hide the Portland Candidate Drive Times layer by clearing the check box next to the layer name (red circle above). The drive-time polygons will disappear from the map.
From the objects menu choose Copy Objects again. This time from the left column ("choose from active layer") click next to "Objects checked in the object manager". The Object Manager will appear to the left, showing the two sites. Click the checkbox next to the Beaverton site
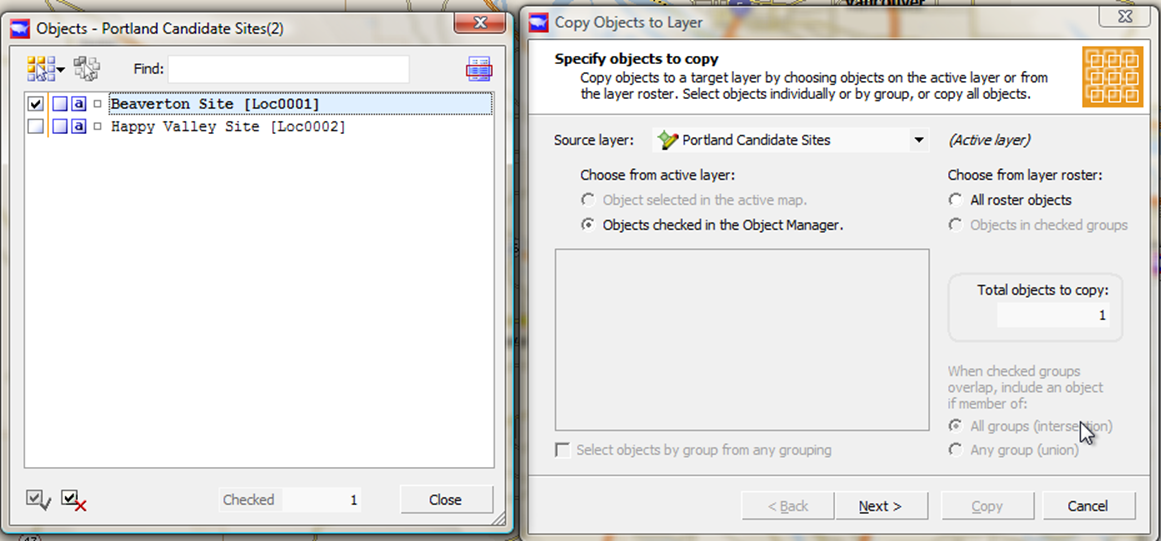
Another option of Copy Objects, using the Object manager
Click "next" to get the "Choose target layer" step and click "new areas" in the list of possible target layers. Here enter the name Portland ring areas, and where it says radii: one, three, five, just leave those numbers there and click OK then click the copy button and you will see 1-3-5 mile buffer appear in the map.
But wait! You can customize object attributes as you create them.
Customizing new Object Attributes
Before you click OK on the "Create Layer - Areas" dialog, what if you want to customize the appearance of the site label, the site marker, or the text labeling each ring? You can do this by clicking on any of the three panels (circled in red) below.
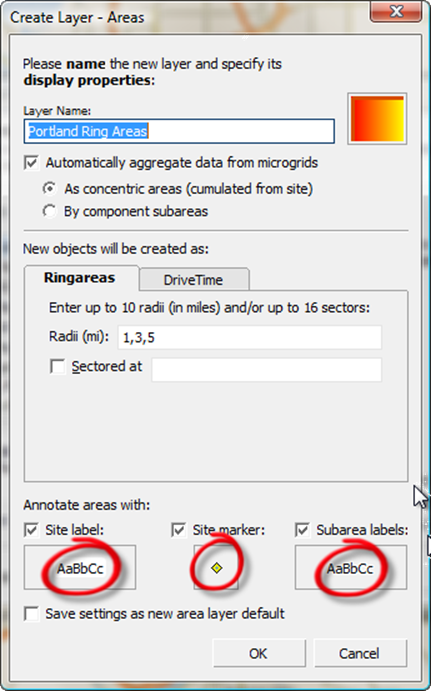
Customize a new layer's attributes (three red-circled buttons, above)
Also notice the three checkboxes underneath the phrase "Annotate areas with: ". These checkboxes control the hiding/showing of the site label, site marker, and subarea area labels respectively.
When you click the site label lettering button "AaBbCc" in the "Create Layer" dialog, above, the Label Style Selector appears, as shown below:
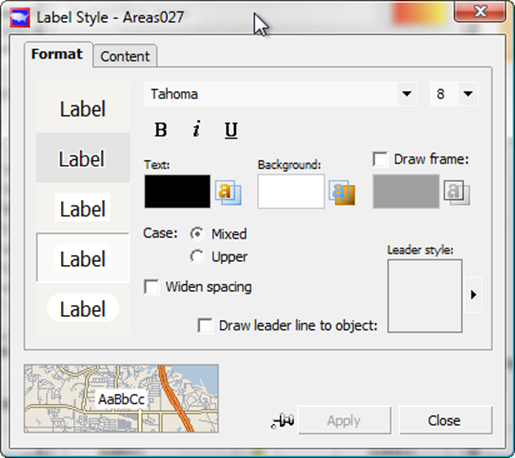
Control label style
Here, in the "Format" tab of the Label Style Dialog, you can choose a variety of label styles and fonts. The changes you make are previewed in the small map inset at the lower-left of the dialog -- the one with "AaBbCc" in the center of it.
Notice another tab next to the "Format" tab: the "Content" tab. This tab offers naming options to be used when data exists on a layer. Data will be summarized to this layer, but only after the layer is created. So for now, go ahead and -- if you wish -- make your label style and font changes and click "Apply".
When you click the site marker symbol, in the "Create Layer" dialog, just to the right of the site label style control that we just worked with, the Symbol Style selector appears.
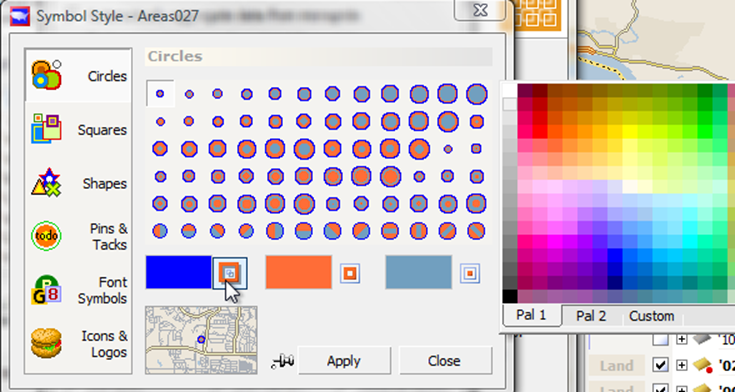
Symbol style selector
Here is where you can select circles, squares, or shapes as site symbols. You can also customize their colors. Click "Circles" then notice three color panels underneath the six rows of different-sized circles.
The leftmost panel ( deep blue, above) controls the color of the line around the symbol.
The rightmost panel (slate grey above) controls the color of the interior of the symbol.
The middle panel (orange, above) controls the color of the other part of the interior of the symbol. You can change colors then click apply and your changes will take effect.
Another fun button on the Symbol Style dialog is the Icons & Logos button in the lower left.
Here is where you can insert custom icons into your maps, which you have previously prepared as JPEG, GIF, or PNG images.
If you want the site marker that is the picture of a hamburger click the hamburger, click apply, and then click OK. Then when you click copy, you will see a one-three-five-mile ring appear in the map, with your new font for the label in the picture of the hamburger at ground zero.
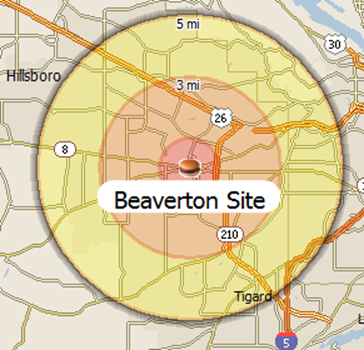
Beaverton site, showing 'hamburger' logo at site
You may be wondering, "where should I put these image files?" The answer is: put them in the symbols folder, within the ScanUS folder, you will find in your "documents" or "my documents" folder. In other words:
"username/documents/ScanUS/symbols"
"username/My Documents/ScanUS/symbols"
The next time you start Scan/US, your new symbol files, which can be ".jpg", ".png" or ".gif" will be available for use in the Icons & Logos button in the Symbol Style Selector.
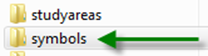
Put custom location symbols into the 'symbols' folder, at users/yourname/documents/ScanUS/symbols
One last word on our example -- looking at data for the ring.
Finally, with rings as with drive time areas, from the Scan/US Data menu, choose "Quicklook.." and see demographics for the rings. The object Drop-down (red circle below) will let you switch between the different rings.
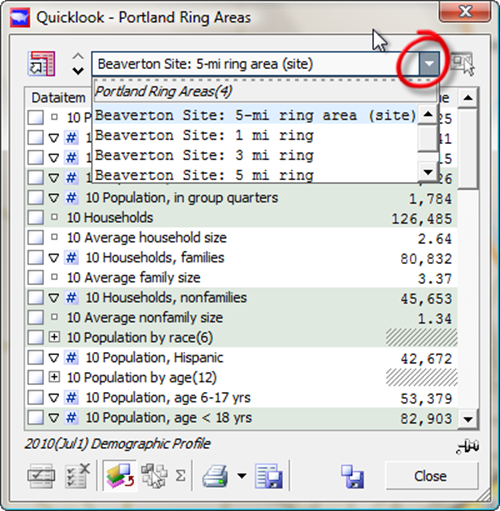
Quicklook showing demographics for Beaverton ring area
To review, here is what we looked at:
- Selecting an object
- Creating new locations by clicking in the map
- Creating Drivetime contours using "Copy objects"
- Creating Ring areas using "Copy objects"
- Customising label and point attributes
- Loading your own symbol into Scan/US