
Scan/US Map Gallery
Scan/US lets you make orientation maps, showing locales and distances. You can make data maps too, to see the geography of your data.
This map gallery shows maps you can make with Scan/US. It introduces two simple, powerful tools used on data: the Strata Manager (Data: Classify by Value) and Group by Object.
Here is our agenda:
- An orientation map, showing location map symbols, and household income for ZIPs
- The same map with employee counts (a component of ‘daytime population’) on MicroScan/US Microgrids(™) s
- The Strata Manager in action
- A map of average family income for all the ZIPs in the US
- How to micro-target an area using Scan/US Microgrids(™) and ZIP+4 locations
- A per capita income map on Census Block groups
- The same area showing aggregate income
- US household income per square mile, by county
An orientation map
This map centered on a store location in Madison, Wisconsin shows coffee shops within half a mile of the store.

These two maps combine orientation (showing streets and ZIP codes, and the coffee shops near the store) with a demographic data map. The ZIP map shows that the area near the store has a lower household income than the ZIP codes nearby.
Let’s use Scan/US Microgrids(™) to take a closer look, using the “ Count of Employees” data variable that you get as part of the Scan/US Premium:Daytime Subscription:
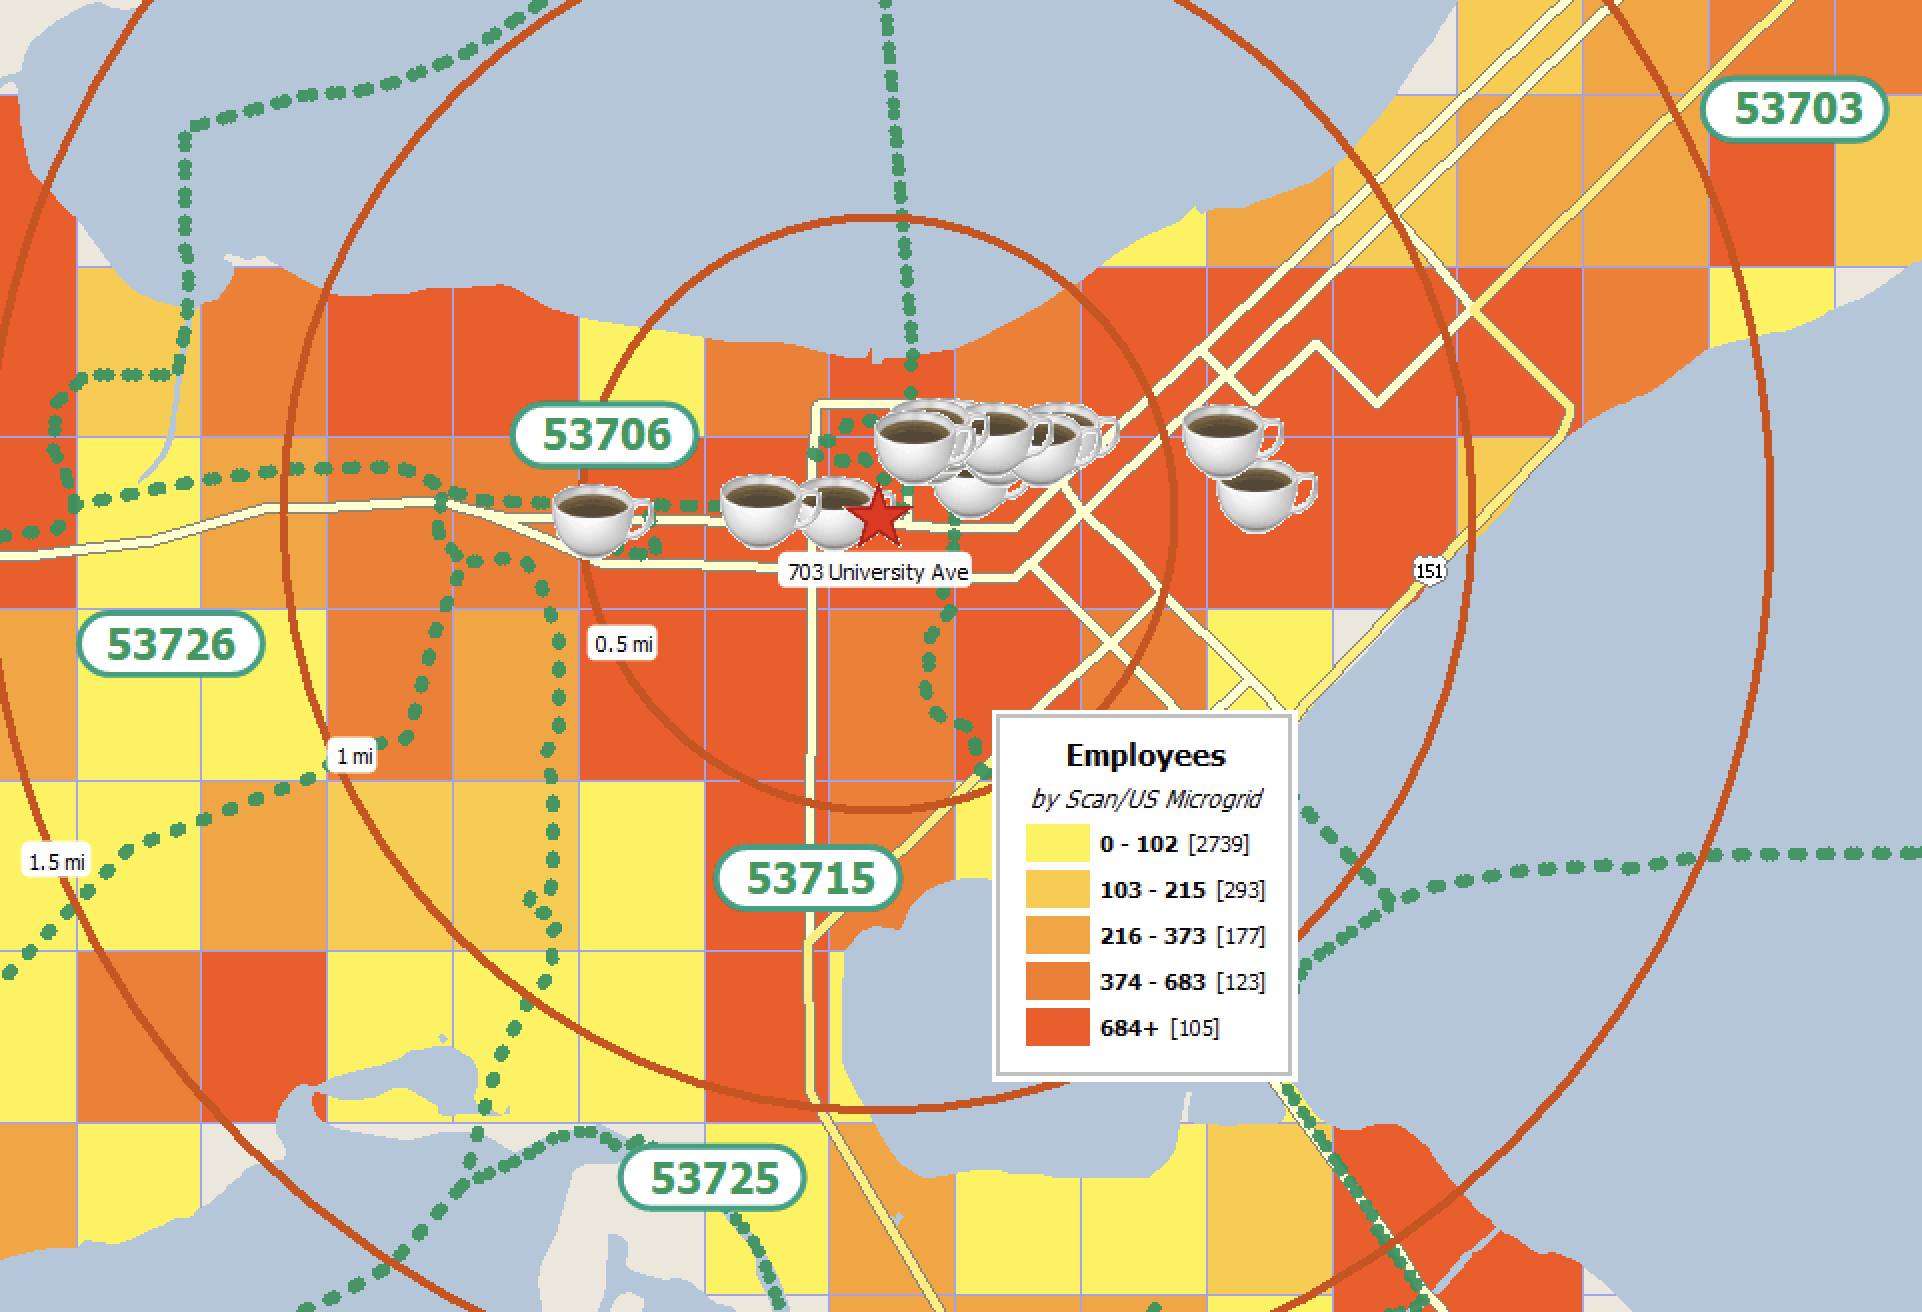
That’s a great “heat map” effect. Now you can see why there are so many coffeeshops. There are a lot of employees in the area during the daytime. Where do the strata come from?
That’s where the Scan/US Strata Manager comes in. You can define the strata based on what you need to show, or discover. The Strata Manager starts out by analysing the data in the map objects, finding the minimum, maximum, and assigning counts to strata. The following illustration shows what the distribution looks like when equal-count intervals are selected:
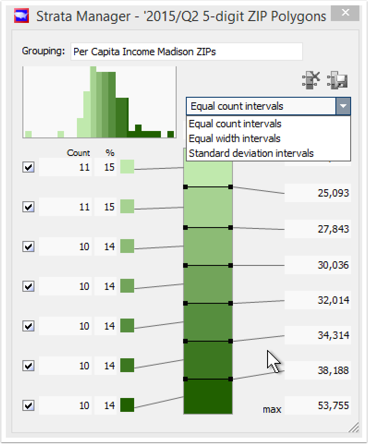
You can see in the upper left-hand corner of the strata manager a distribution of the data for the cuts you have chosen.
A drop-down offers three choices (for this particular variable): Equal-count, Equal-width, and the statistical distribution by standard deviation.
The same dataset can be distributed according to standard deviation as shown below:
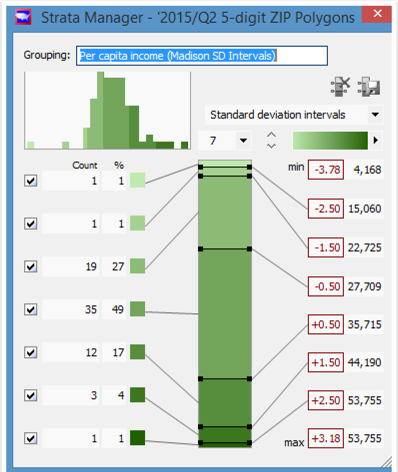
A distribution based on standard deviation is better for finding the real outliers, both high and low, in a population.
You can make changes by entering new target numbers on the right, or by dragging the strata dividers up and down. You can also give the strata a new name, which will appear on the map legend.

This permits a map which does not overweight just a few ZIPs with the high average that you get with equal width intervals. Here is a Quartile dispersion-based interval map of ZIP codes within Cook County, Illinois:

Average family income on US ZIPs
Scan/US colors the map based on your strata definitions. The national ZIP map below, showing average family income, is done with standard-deviation-based intervals:
This map shows the top 667 ZIPs with the highest average family income. Something to remember about using average income: averages can be skewed higher by the presence of a few extremely wealthy individuals. When you are looking for the middle of the distribution, it’s better to use median income.
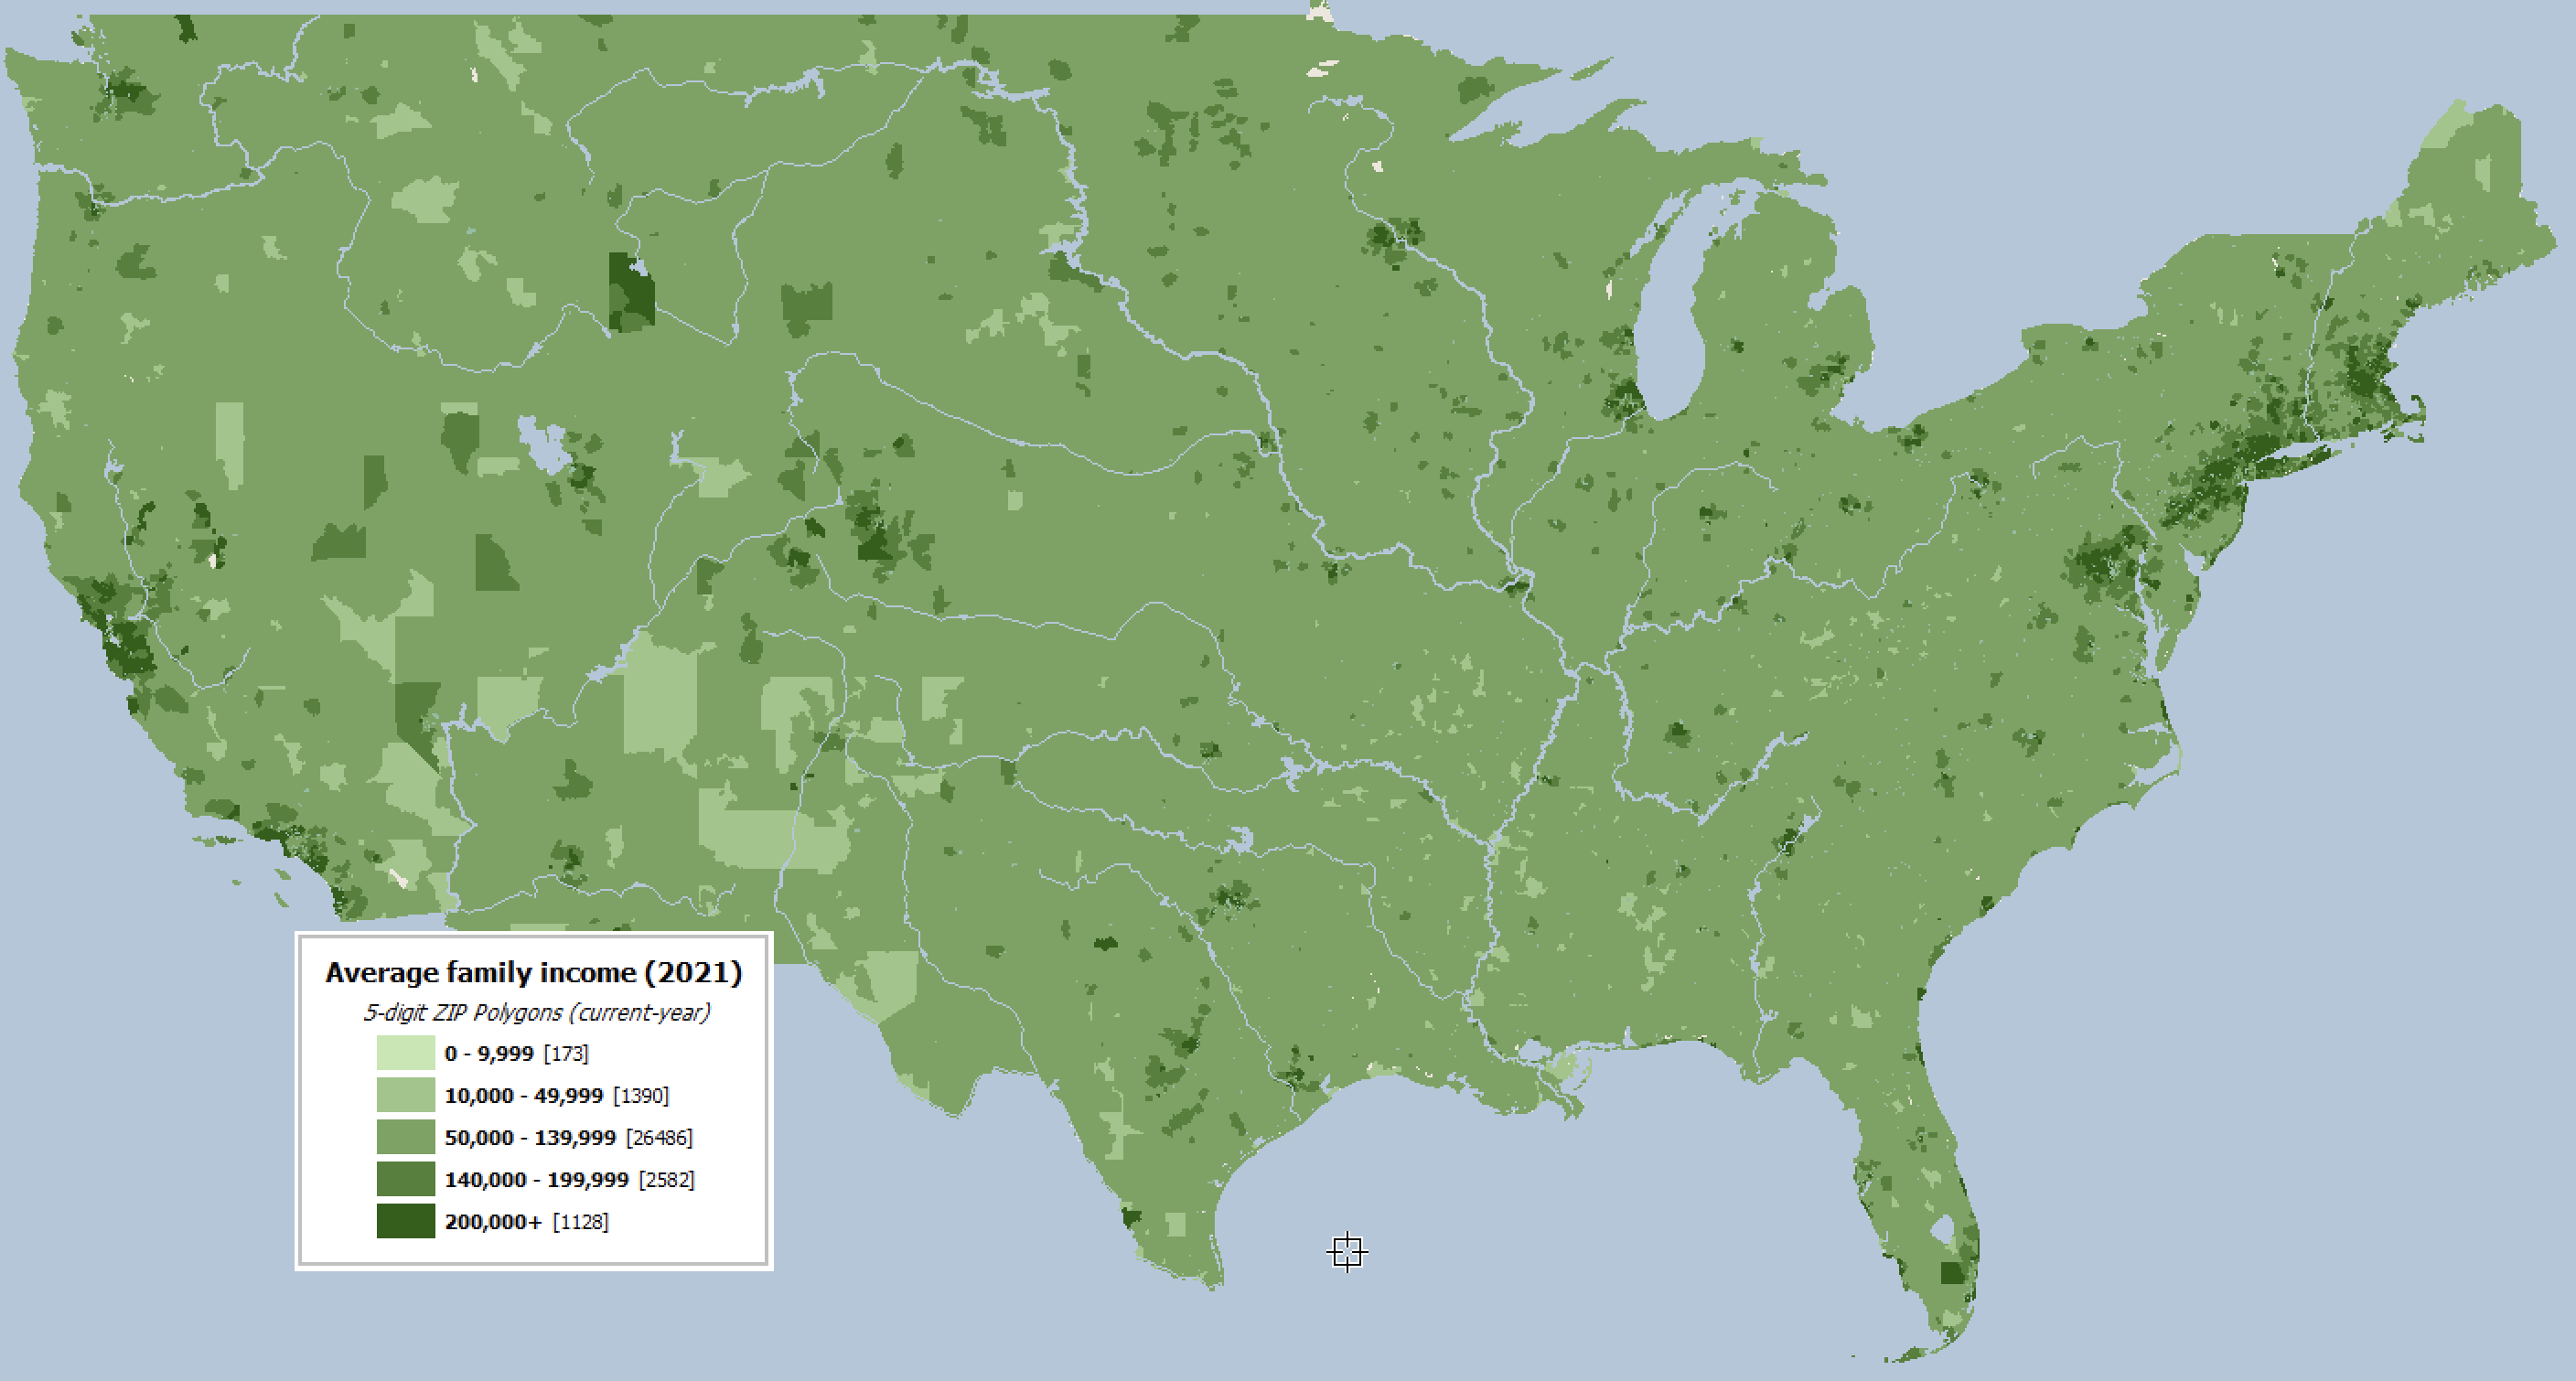
This ZIP map shows concentration of wealth around large cities, and also near Sun Valley, Idaho, Jackson Hole, Wyoming, and up in the mountains of Colorado. This is largely due to wealth within large-land-area ZIPs in the West.
Strata Manager can be used to discover concentrations of population, concentrations of income, or any other demographic variable.
Translate Demographics into Action
Another use of Strata manager is to take demographic information on one map layer, and translate it into information you can act on, in another map layer.
Suppose you have a trade area you would like to reach by mail. You can use Microgrid demographics to target ZIP+4 locations for mailing.
Rather than the incurring the expense of mailing to your entire trade area, you can “micro-target” just a few areas which match demographics for the product you want to promote.
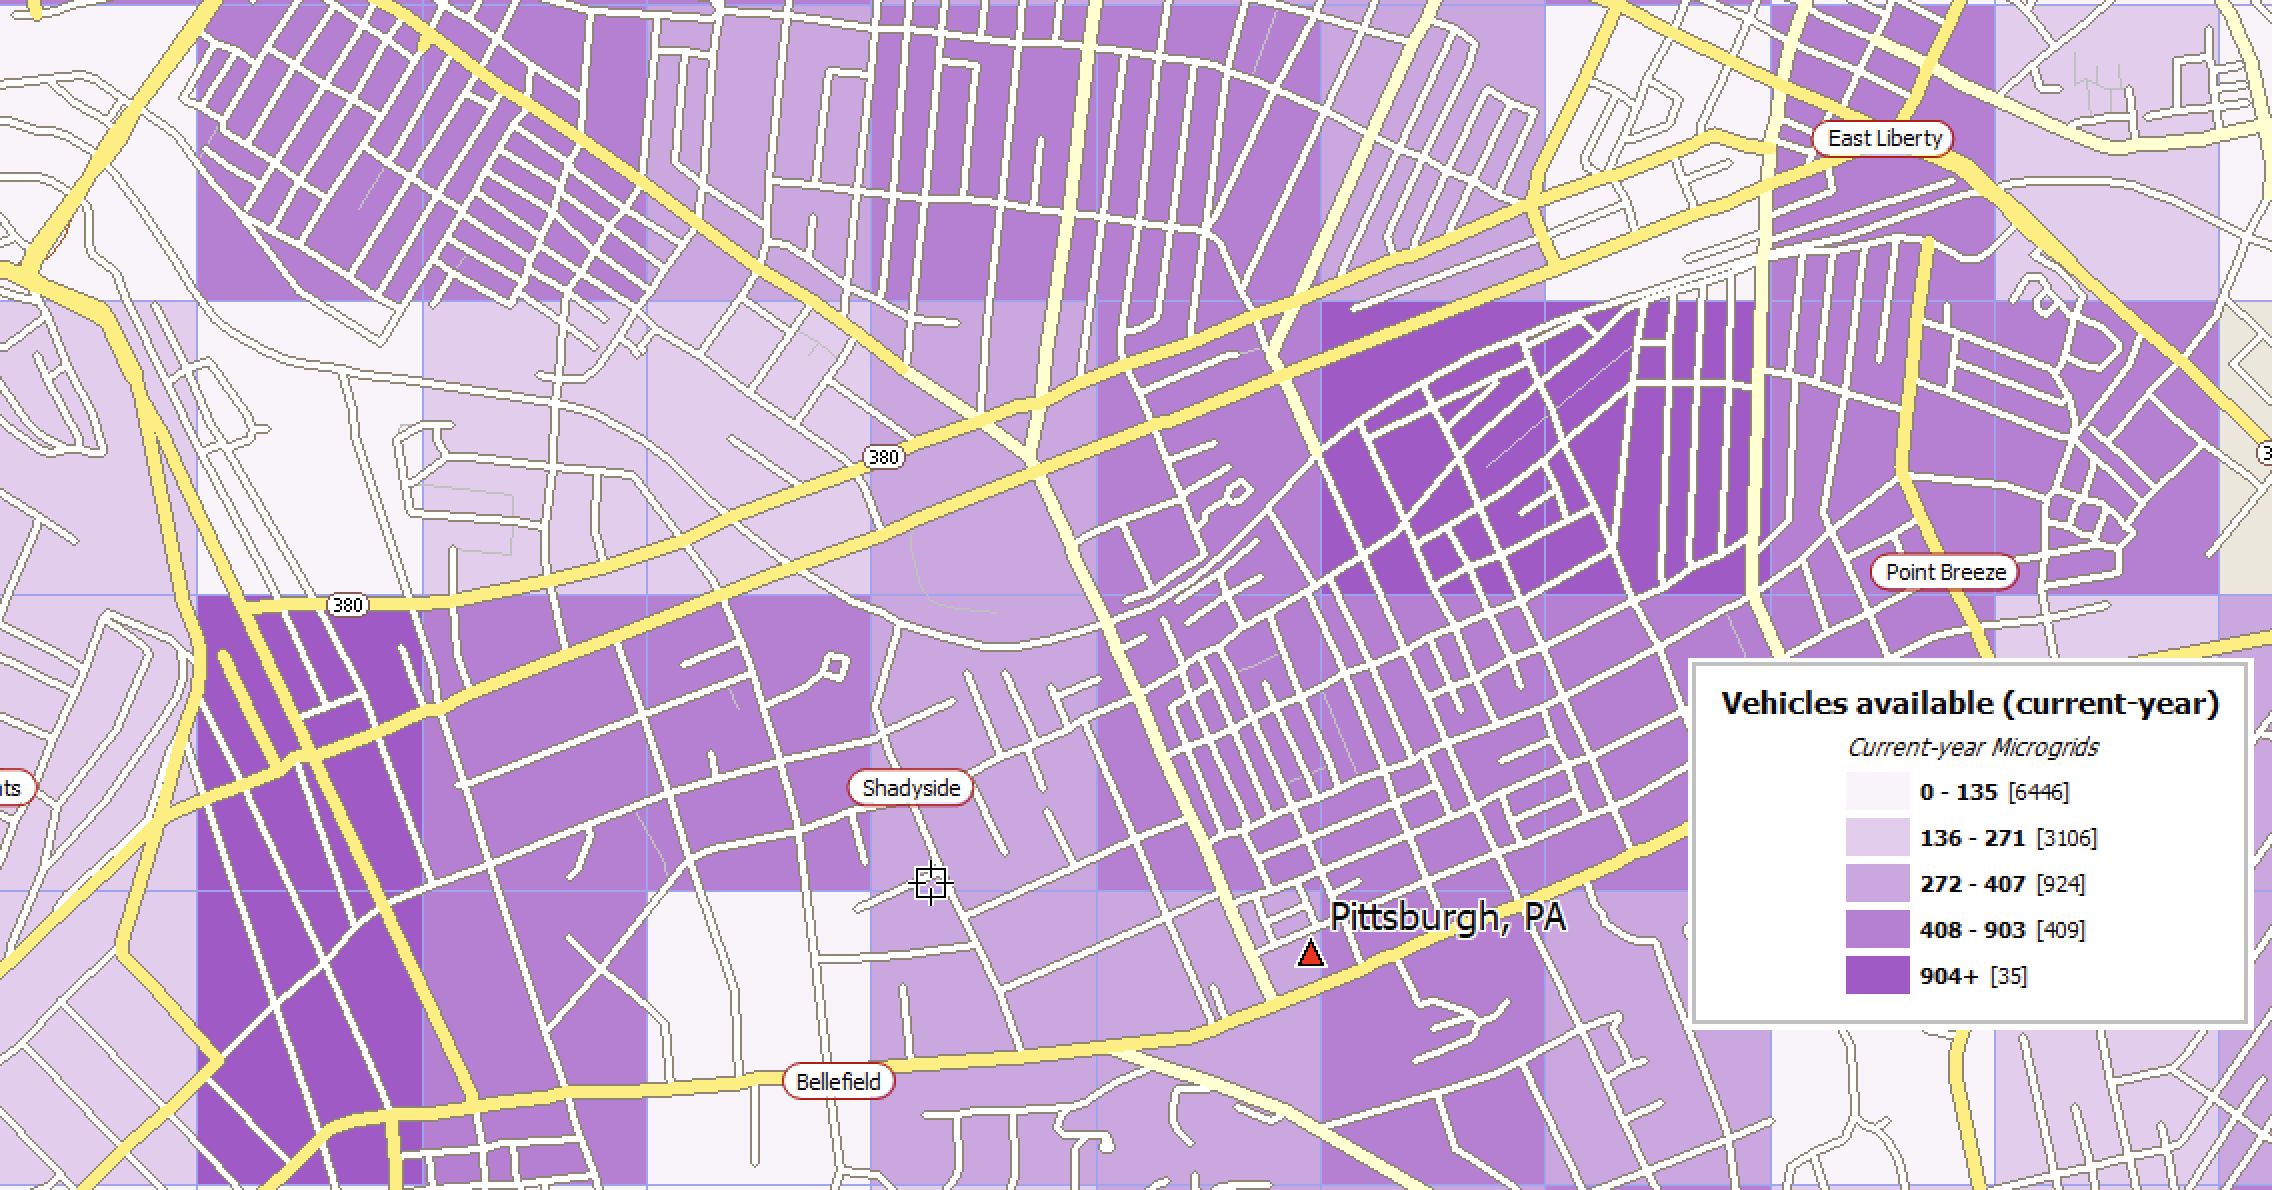
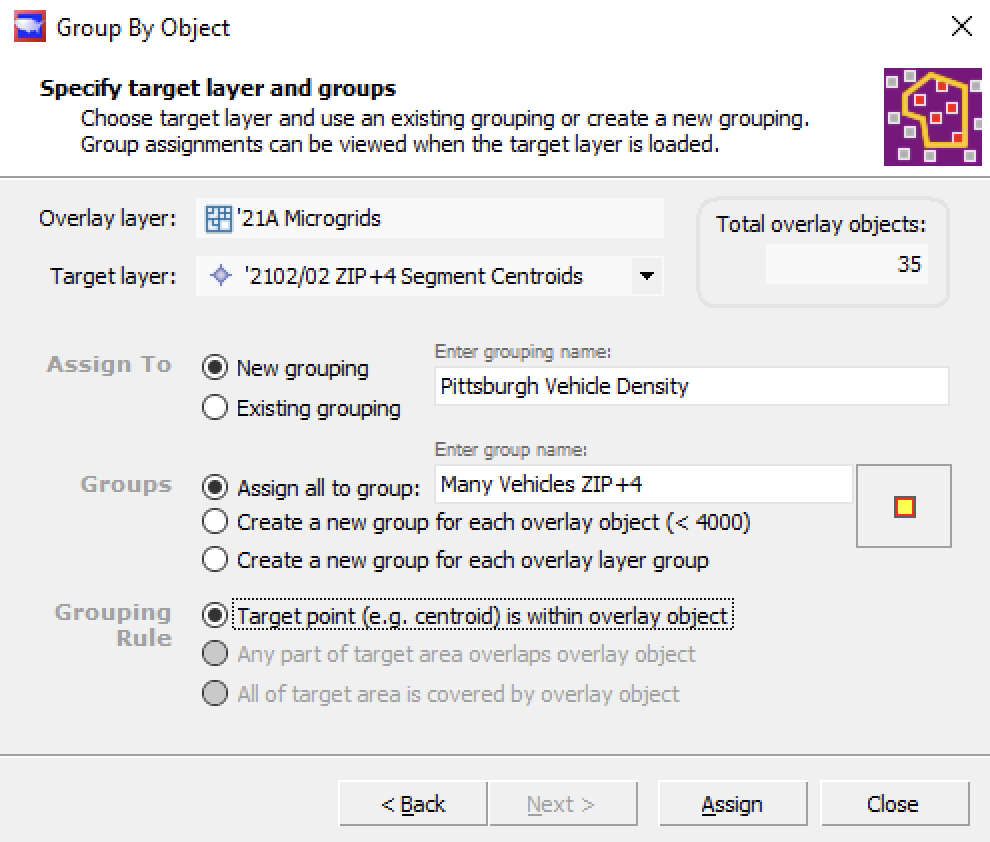
This example shows how to do this, using data from the Scan/US Microgrids, and the ZIP–4 layer. First set up your Microgrid layer with the demographic variable you want, and then use the strata you are interested in to group the ZIP+4’s that fall into those grids. Then, you can send the Z–4 list to your mailing house.
Here is the trade area, with the top 4 microgrids colored in deep purple. Total (current-year) vehicles available is the demographic statistic we are using. Perhaps you want to start a “we wash your car at your own house” business in the area.
Then, Zip+4’s can be brought into the map, and a grouping created based on just those 4 high-valued microgrids.
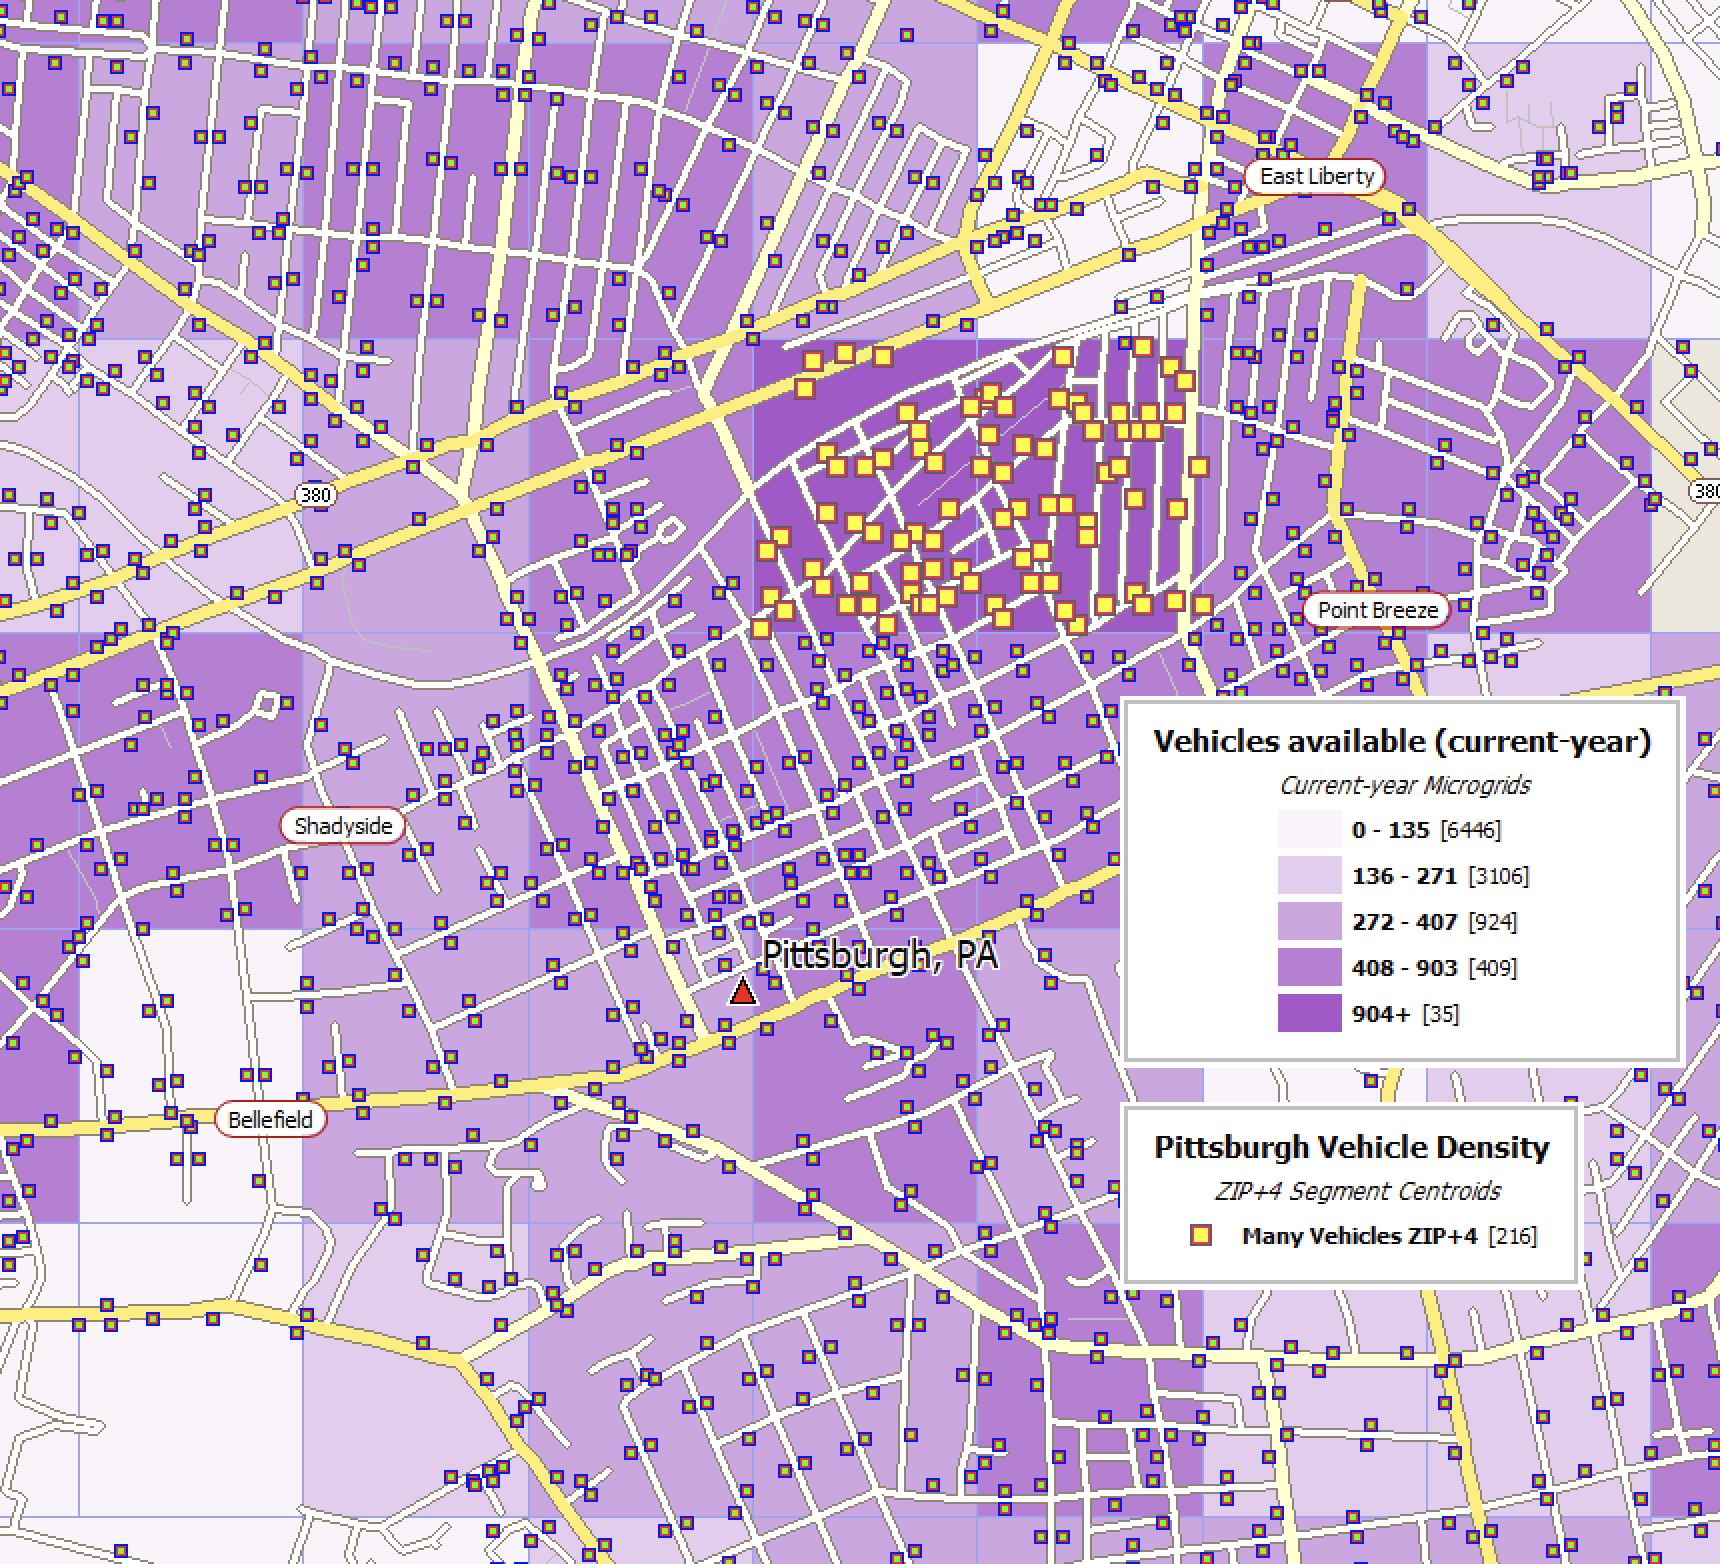
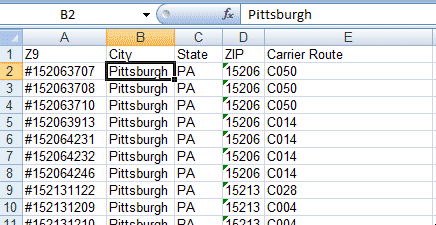
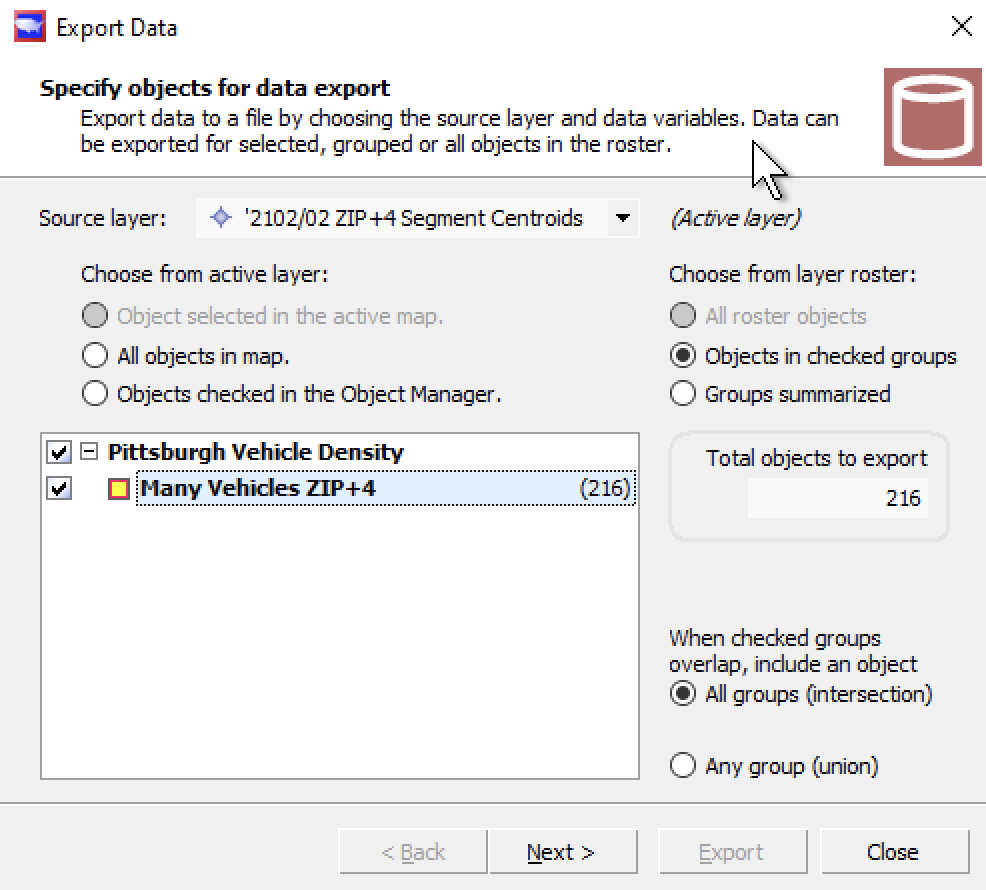
These 160 ZIP+4s can be exported to Excel and used for mailing.
Two simple steps
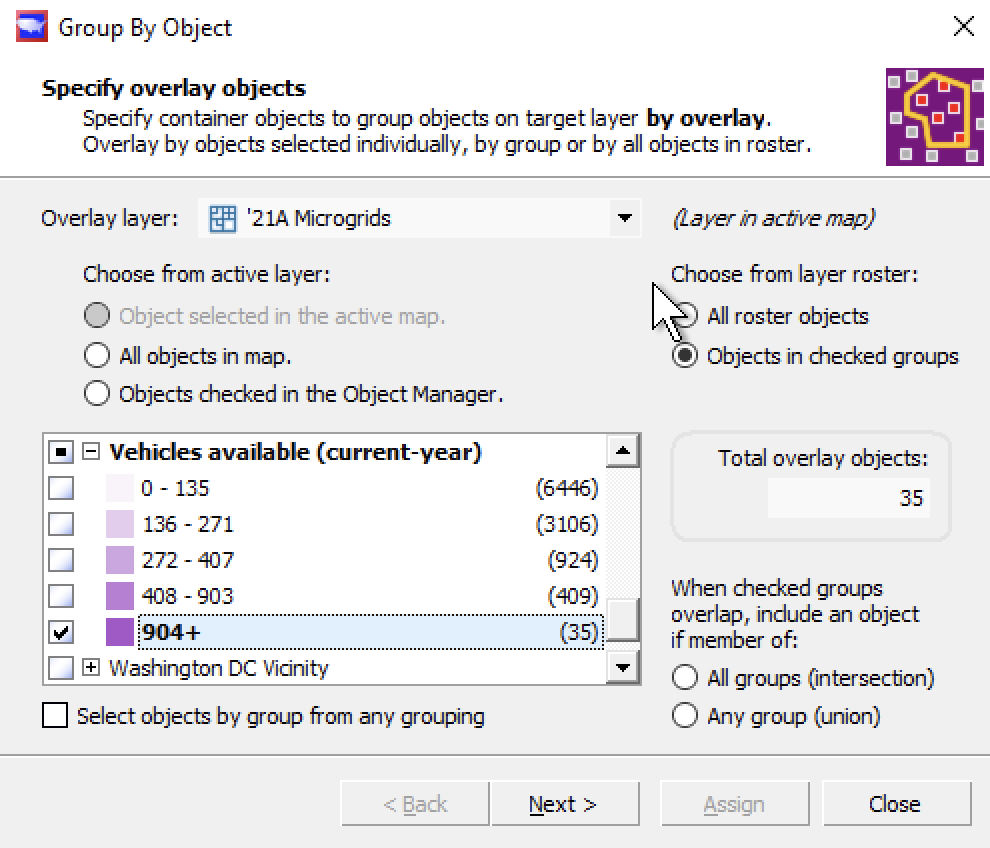
The “group by object” steps are simple.
First, choose the high-value microgrids on the overlay layer.
Then, choose the target layer and name the new group on the target layer
Scan/US Microgrids(™) (with demographic data), and USPS Zip+4 locations are included in all Scan/US subscriptions.
Export your data
This isn’t really part of the map gallery, but it’s so easy to show: Exporting your data is just one step. Choose “Export Data” from the data menu, and select your group.
Make maps with any variable, any layer.
With hundreds of demographic variables to choose from, at all levels of geography, you can make maps like these:
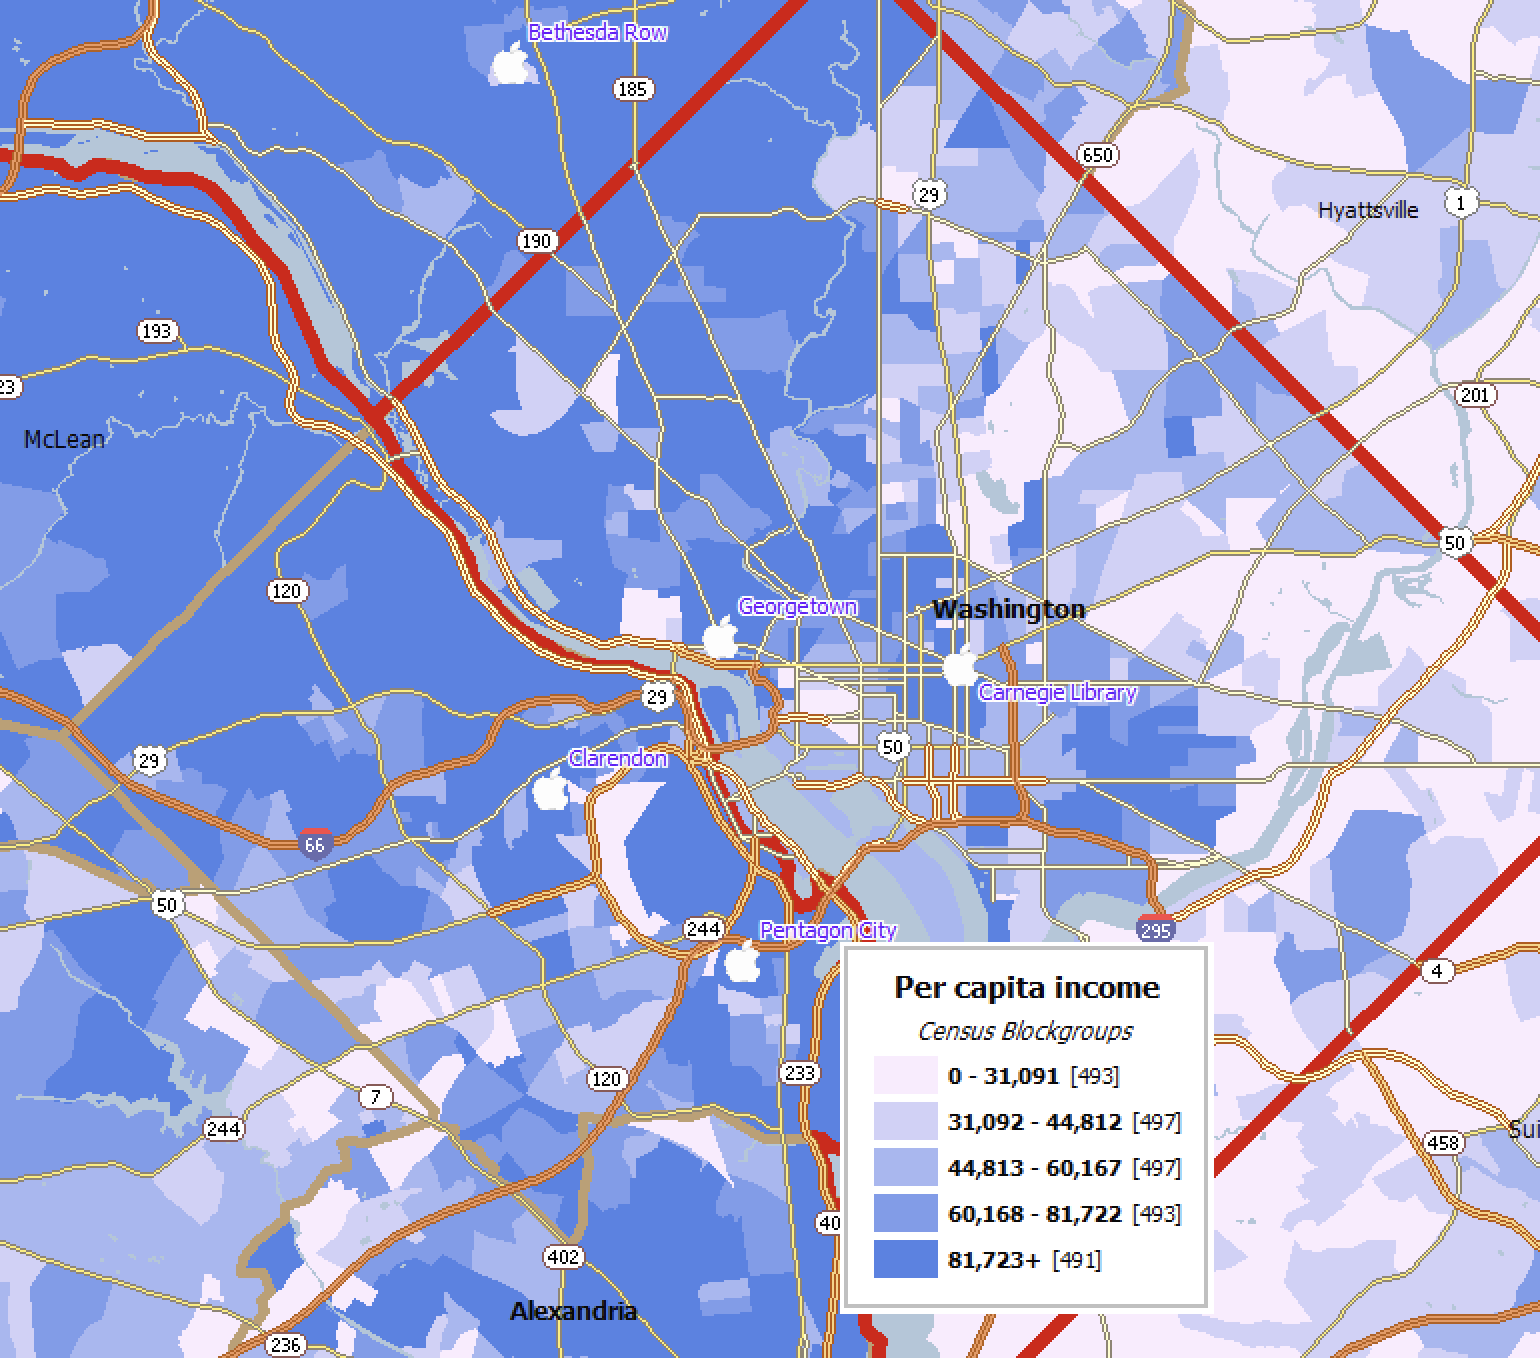
Per Capita Income on Census Blockgroups
Income per capita is useful, since it gives a per-person income statistic which is not distorted by household size or population concentration. This map is drawn on Census Block groups, which are more accurate in city centers than they are out in the countryside. Scan/US Microgrids(™) would probably give a better picture of income distribution in this area.
Aggregate Income on Scan/US Microgrids(™)
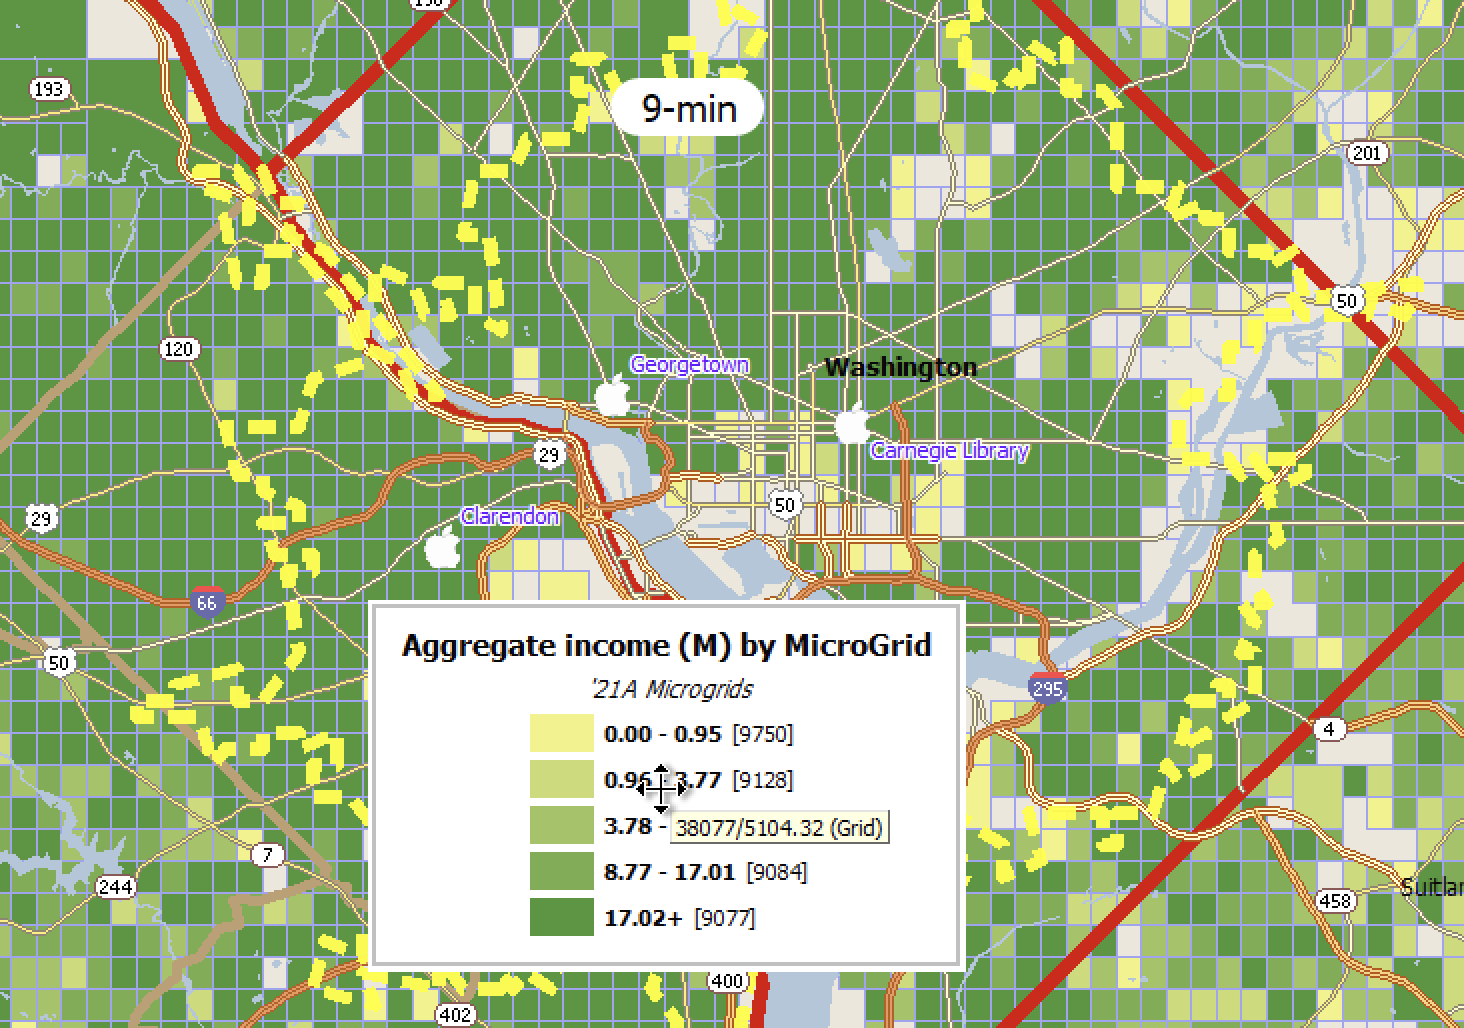
Aggregate income shows a total of all income from all households. This map is drawn on Scan/US Microgrids, which show a better countryside view than Census Blockgroups, and give more detail in urban centers too. Scan/US Microgrids(™) are re-drawn each year to reflect population change. A 25-minute drivetime polygon has been added to this map. Drivetime polygon generation capability is included in every Scan/US Subscription.
United States household income per square mile
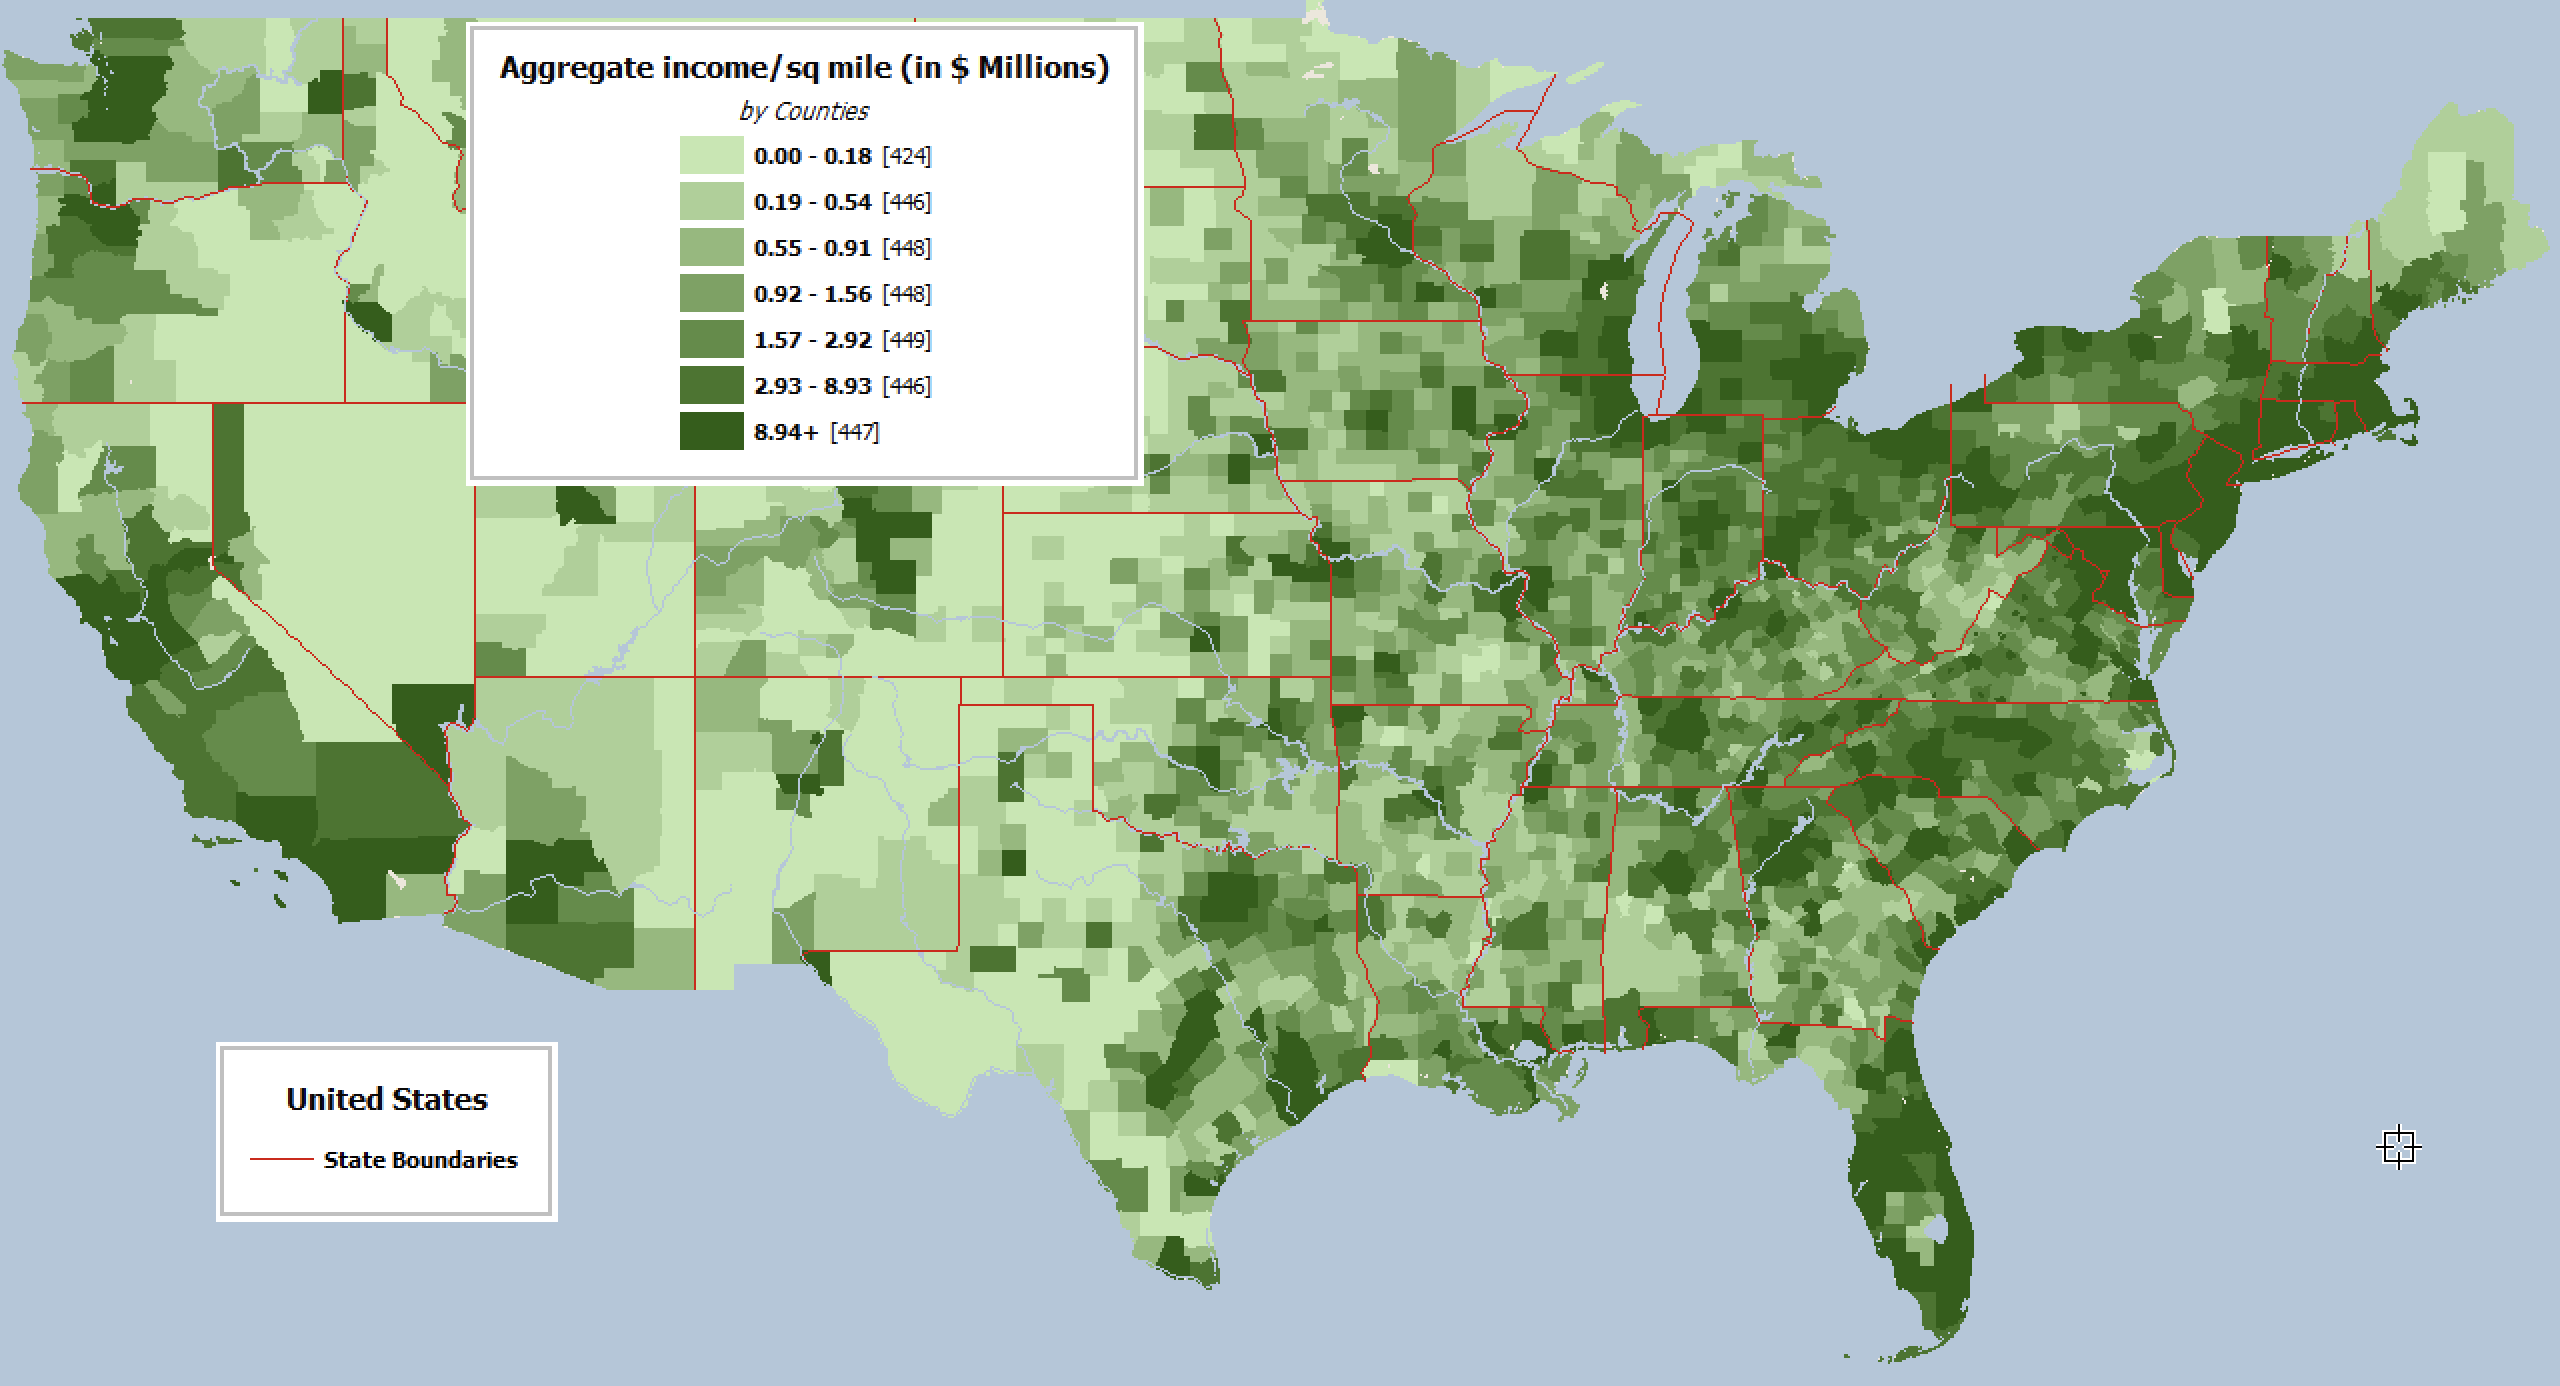
Household income per square mile gives a view of population density and income at the same time. Here it is shown at the county level, but you can make a more-detailed map on ZIPs, tracts, block groups, or grids.
Strata Manager and Classify by Value demographic map creation are a standard feature of every Scan/US Subscription.
Many other kinds of maps are possible, either national in scope, or focused local maps.
© 1992-2026 - Scan/US, Inc.