
Scan/US Microgrids: Yesterday and Today
Tracking Residential Growth With Scan/US Microgrids(™)
Scan/US Microgrids(™) are square grids on the map in three sizes, roughly 1/16 square mile, one-quarter square mile, or 1 square mile.
A technical way of saying this is: Microgrids are spherical quadrilaterals defined in relation to the latitude-longitude grid. There are 3 sizes - 1 minute grids, 1/4 minute grids (4 per minute grid) and 1/16 minute grids (16 per minute grid).
Each Scan/US Microgrid(™) is a data container, holding population characteristics or other demographic data for that small area.
The three sizes of Scan/US Microgrid(™) are determined by household density in an area.
Overall, approximately 3.4 million grids cover ONLY the populated areas of the United States. Demographic data is provided for each grid.Scan/US Microgrids(™) make it possible for the software to calculate instant data summaries for rings, polygons, and drivetime contours.
Note: although 2010 was used to make illustrative maps for the first part of this description of Scan/US Microgrids(™), Scan/US Microgrids(™) are updated annually, to reflect local changes in population.
We should also note that, although this study shows how Scan/US Microgrids(™) are better than Census Blockgroups for doing demographic analysis, all Scan/US Subscriptions do include Census Blockgroups with demographic data (and Census blocks and data are available as well), so if you have a Scan/US Subscription, you can do the comparison yourself, in any study area where you require it.
This three-part description shows how Scan/US Microgrids(™) are better.
- First we present an overview
- Second, in a more detailed look, we compare the Scan/US Microgrid(™) view of households on the ground , compared with the BG/Block depiction.
- Finally we discuss one grid in detail with 2010 data, and then touch base with the same grid for 2024.
1. The Study Area
Our 'study area' is a four block-group area in Santa Clarita, CA. This area illustrates how Scan/US shows change with its proprietary Scan/US Microgrid(™) geography.
As of 2000, US Census records 12 households in these four block groups. The Scan/US 2010 mid-year estimates show 2,835 households in residence, 90% of them new since 2005.
Four Census block-groups showing streets based on TIGER 2009 streets
A 2009 satellite image shows the extent of development that is revealed in the Scan/US 2010 estimates. (Google Earth photo)
This table summarizes the residential development in this 1.64 square mile area between 2000 and 2010.
2. Zooming in to the Neighborhood: Scan/US Microgrids(™) and Zip+4s and their relation to data
Using Zip+4 segment points, Scan/US tracks the placement of residential change more accurately than Census block groups or Census blocks.
Zip+4 segments are the basic units of the postal delivery system. Scan/US Scan/US Microgrid(™) cartography, summarizing data from Zip+4 segments, brings residential change into focus at the resolution of 1/16th of a square mile.
The study area contains 4 block groups, 12 blocks, 25 Scan/US Microgrids(™) and 274 Zip+4 segments. Residential saturation data (“drop counts”) for Zip+4s provide the data points for distributing block group estimates of household counts. How is this done?
First the drop counts of the blocks within a block group are normalized and used as weights to distribute the block group’s updated demographics to the blocks. The resulting detailed demographics for the blocks are then rebalanced to conform to the parent block group’s demographic profile. The distribution of the balanced block updates to the Scan/US Microgrids(™) is accomplished by using the current Zip+4 drop counts to calculate the proportion of block demographics that are to be assigned to the overlapping grids.
The Scan/US Microgrid(™) highlighted on the map derives all of its
characteristics from one block but the Scan/US Microgrid(™) overlay of
the study area shows that, in many cases, multiple blocks
and block groups contribute to a particular grid’s
demographic profile.
Scan/US Microgrids(™) (blue grid) and Zip+4 segments (purple diamonds) superimposed on Census 2000 block groups
3. Focus on Scan/US Microgrid(™) 34118/2734.34
This grid contains the 16 Zip+4s listed below, along with their April 2010 “Drop Counts”.
The Zip+4 drop counts indicate where, how much and what type of development exists right down to a specific address range on a street.
The table below shows the four separate counts that are available for each Zip+4: single family (Napt), multi-family (Apt), business (Bus) and seasonal (Seas). These drop counts tell us that this Scan/US Microgrid(™) neighborhood is made up of exclusively single family dwellings.The satellite photo below shows the 16 Zip+4s overlaid by the grid. (The image was created using Scan/US “Locate in Google Earth,” a standard feature of the Scan/US software).
 The 16 Zip+4 markers on the image pinpoint the housing
associated with the drop counts. The “TotRes” drop count
approximates “total housing units” not “occupied housing
units” or households. A cursory rooftop count of the
housing seen in this satellite image of the grid comes to
120 housing units (as of the date of the image) compared to
the “TotRes” counts of grid total of 170. The Scan/US 2010
balanced estimate of total housing units in the grid is 108
units.
The 16 Zip+4 markers on the image pinpoint the housing
associated with the drop counts. The “TotRes” drop count
approximates “total housing units” not “occupied housing
units” or households. A cursory rooftop count of the
housing seen in this satellite image of the grid comes to
120 housing units (as of the date of the image) compared to
the “TotRes” counts of grid total of 170. The Scan/US 2010
balanced estimate of total housing units in the grid is 108
units.
| ZIP+4 code | TotRes | Napt | Apt | Bus | Seas |
| 91354-1848 | 8 | 8 | 0 | 0 | 0 |
| 91354-1850 | 16 | 16 | 0 | 0 | 0 |
| 91354-1854 | 18 | 18 | 0 | 0 | 0 |
| 91354-1856 | 6 | 6 | 0 | 0 | 0 |
| 91354-1857 | 11 | 11 | 0 | 0 | 0 |
| 91354-1860 | 6 | 6 | 0 | 0 | 0 |
| 91354=1861 | 6 | 6 | 0 | 0 | 0 |
| 91354-1868 | 18 | 18 | 0 | 0 | 0 |
| 91354-1872 | 14 | 14 | 0 | 0 | 0 |
| 91354-1876 | 6 | 6 | 0 | 0 | 0 |
| 91354-1878 | 11 | 11 | 0 | 0 | 0 |
| 91354-1879 | 13 | 13 | 0 | 0 | 0 |
| 91354-1887 | 8 | 8 | 0 | 0 | 0 |
| 91354-4930 | 6 | 6 | 0 | 0 | 0 |
| 91354-4931 | 6 | 6 | 0 | 0 | 0 |
| 91354-4935 | 17 | 17 | 0 | 0 | 0 |
| Grid totals | 170 | 170 | 0 | 0 | 0 |
In conclusion: Scan/US Estimates (2010)
These numbers make this micro-neighborhood one that retailers would be glad to know is in their trade area. The neighborhood size of the Scan/US Microgrid(™) and the demographic information it contains make it the ideal unit of geography for supporting small area location based decisions.
Scan/US updates the Scan/US Microgrid(™) geography annually. The Scan/US QuickLook for this Scan/US Microgrid(™) displays about eighteen 2010 demographic variables selected from approximately 1000 values that are estimated for every object on each geographic layer.
This grid is estimated to contain 99 households with an average household size of 3.10 persons; median household income is $57,790, and an annual aggregate household income of $6,440,000.
Now: Grid Creation Today
Beginning with the 2022A release, Scan/US made a major transition to 2020 Census cartography. All of the base census geography layers are from Census 2020: blocks, blockgroups, tracts, county subdivisions, and counties are 2020 versions.
Along with that change, there was also a major change in the way Scan/US MicroGrids are defined.
This isn't just a superficial map base change. The technical work of bringing over historical census data (2010 and 2000 Census in this case) onto the new 2020 cartography is not simple.
There was a major change to how we define new Microgrids starting with the 2022A version. And release 2022B also shipped to subscribing customers with a new edition of the Microgrid layer providing unprecedented fidelity in representing the location of population and business on the US landscape.
In the 2022 Microgrid layer, the grids were defined using 141 million data points that represent the actual latitude/longitude location of dwelling units, businesses, and group quarters. Those data points resulted from the process of merging US building footprints, US addresses with coordinates, Zip+4 delivery counts and 2020 Census block-level population and household counts.
The database of some 129 million building footprints, accounting for about 98% of US inventory, is derived from the Microsoft Research open source database. The address data were sourced from the National Address Directory and Open Address databases, with the 145 million addresses linked to building locations using the Scan/US Geocoder.
There were 3,406,147 Migrogrids in the 2022B edition. This represents an increase of about 800 thousand over the previous edition. The grids vary in size reflecting relative density of settlement. Most numerous are the fine-grained 1/16th minute grids at 2,071,144, followed by 1,078,649 1/4 minute grids, and 256,354 1-minute grids.
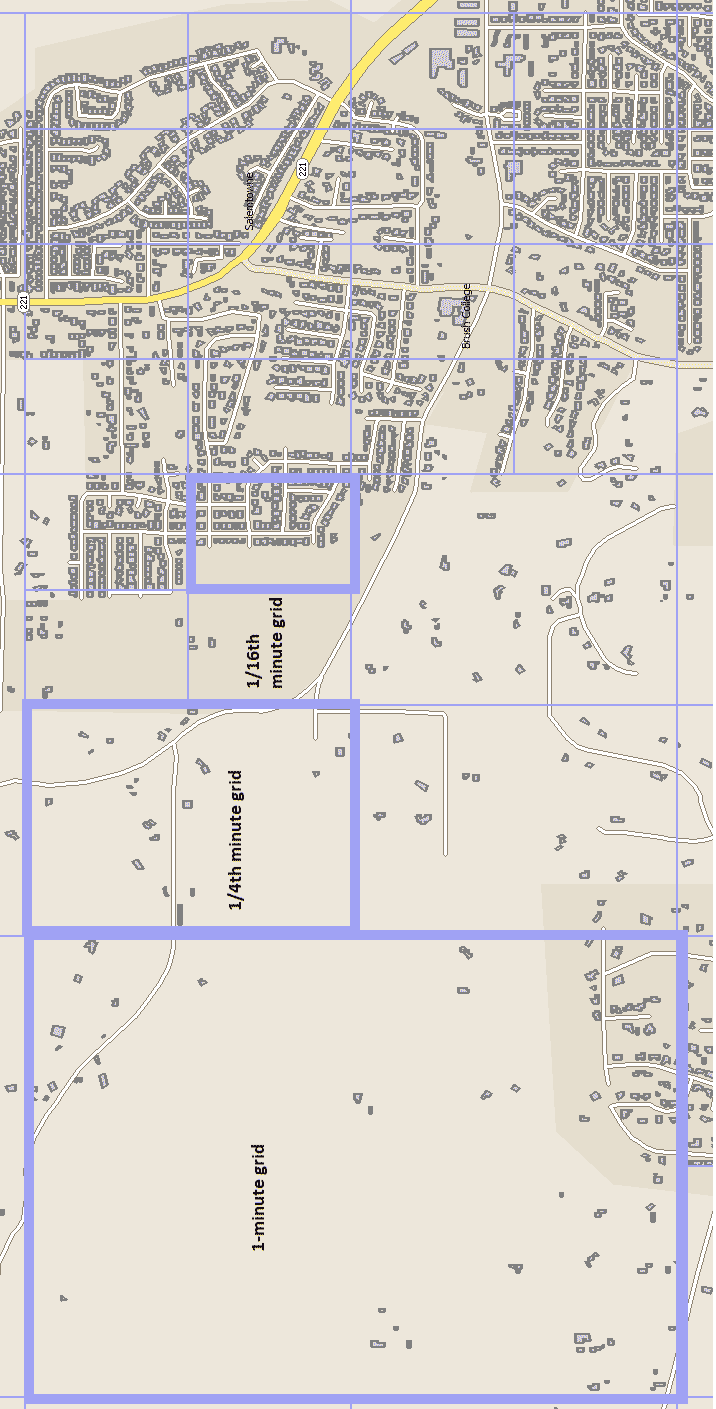
We implemented a new algorithm for optimal sizing of the grids. A 1-minute quadrilateral of latitude and longitude was subdivided into 1/4 minute grids if the housing unit count in at least one of the subgrids exceeded a criterion value. A 1/4 minute grid was subdivided into 1/16 minute grids if at least two subgrids met the criterion. The criterion value was 50 housing units. In addition, 116,535 business-only grids were defined at the 1/16 detail level. The illustration below shows the 3 different-sized grids with streets and buildings overlaid. In the illustrative screen image below (turned on its side), you can see that the grid pattern closely follows the settlement density.
2024A Grids and allocation
Some 2024A microgrids facts
Total 2024A microgrids: 3,440,413
Of these, two million are 1/16th minute, one million are quarter-minute, and 2.5 hundred thousand are one-minute. ( 1/16 min: 2,084,003; 1/4 min: 1,083,725; 1-min: 256,675)
We use four kinds of data points to define today's grids:
- Dwelling unit locations (both single family and multifamily) and trailer locations. These are based on address coordinates matched to building foot-prints; toal locations: 126.6 Million).
- Approximately 725,000 dwelling units are located to Zip+4 centroids rather than building footprint.
- Group quarters in 560,000 Census blocks are located to block centroids.
- There are 14.5 million individual business locations used as input. We use business location coordinates to help define the microgrids but not to allocate population demographics to blocks or microgrids. There are only 120,168 grids with businesses only. Business data are aggregated to blocks, microgrids and Zips using individual business locations.
Return to Scan/US Microgrid(™) 34118/2734.34
If we look again at the area containing the same grid we focused on 12 years ago (above), we can make a number of observations.
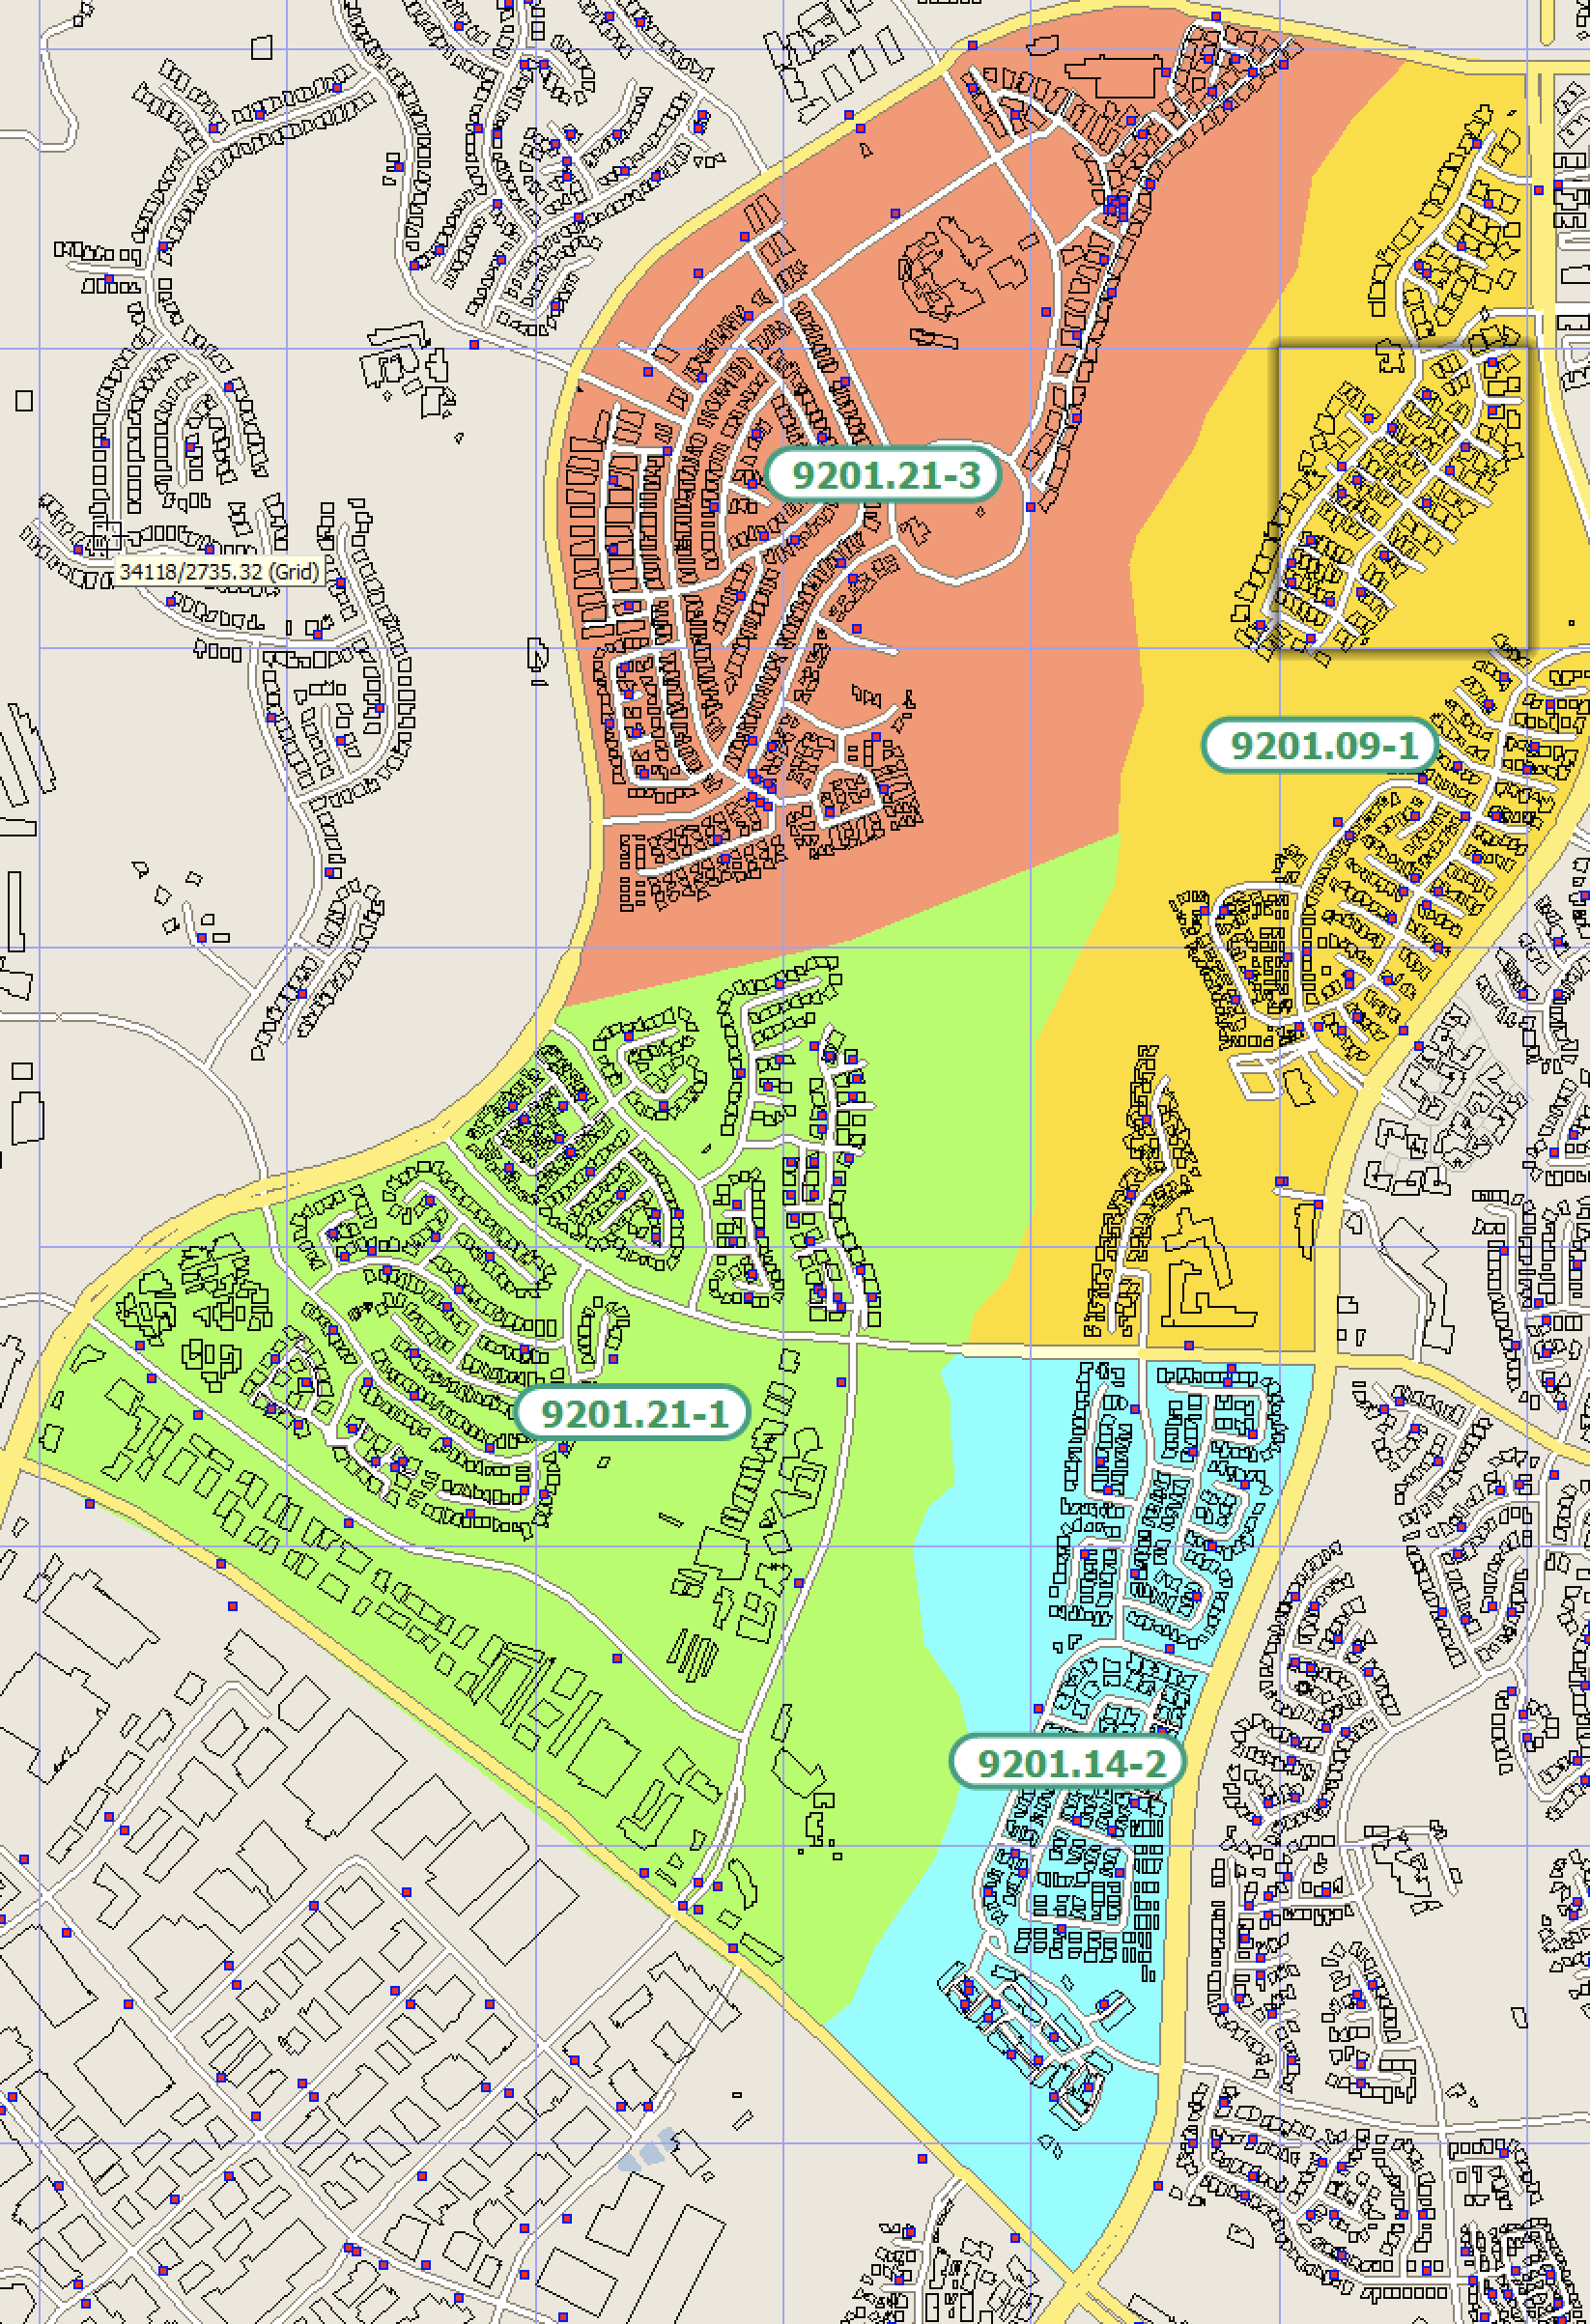
First, the build-out in the block group to the west has been completed. (2024A estimates show 3,359 for this BG). Also, the BG boundary has changed, along with the BG identifier number. Not too surprising, since this was a new development 12 years ago. Second, we don't need to do an aerial photograph to see the building footprints. A decade ago, an aerial provided an illustration of the area, so you could see building sizes and distributions and if, in general, your numbers made sense. Today, we actually use the building footprints in our estimates, both to create the grids, and to help allocate business and residential population.
Looking at the data just for the original grid, we can see that people have finished moving in. The household count has increased from just 99 to 264. The median age has popped up 30 years, which implies that the school age children have grown up and moved out. The median income has increased, which along with the two and a half times increase in the number of households, points up a growth in the aggregate income for just that one grid, from 6.4 million to 26.07 million dollars.
Business grid
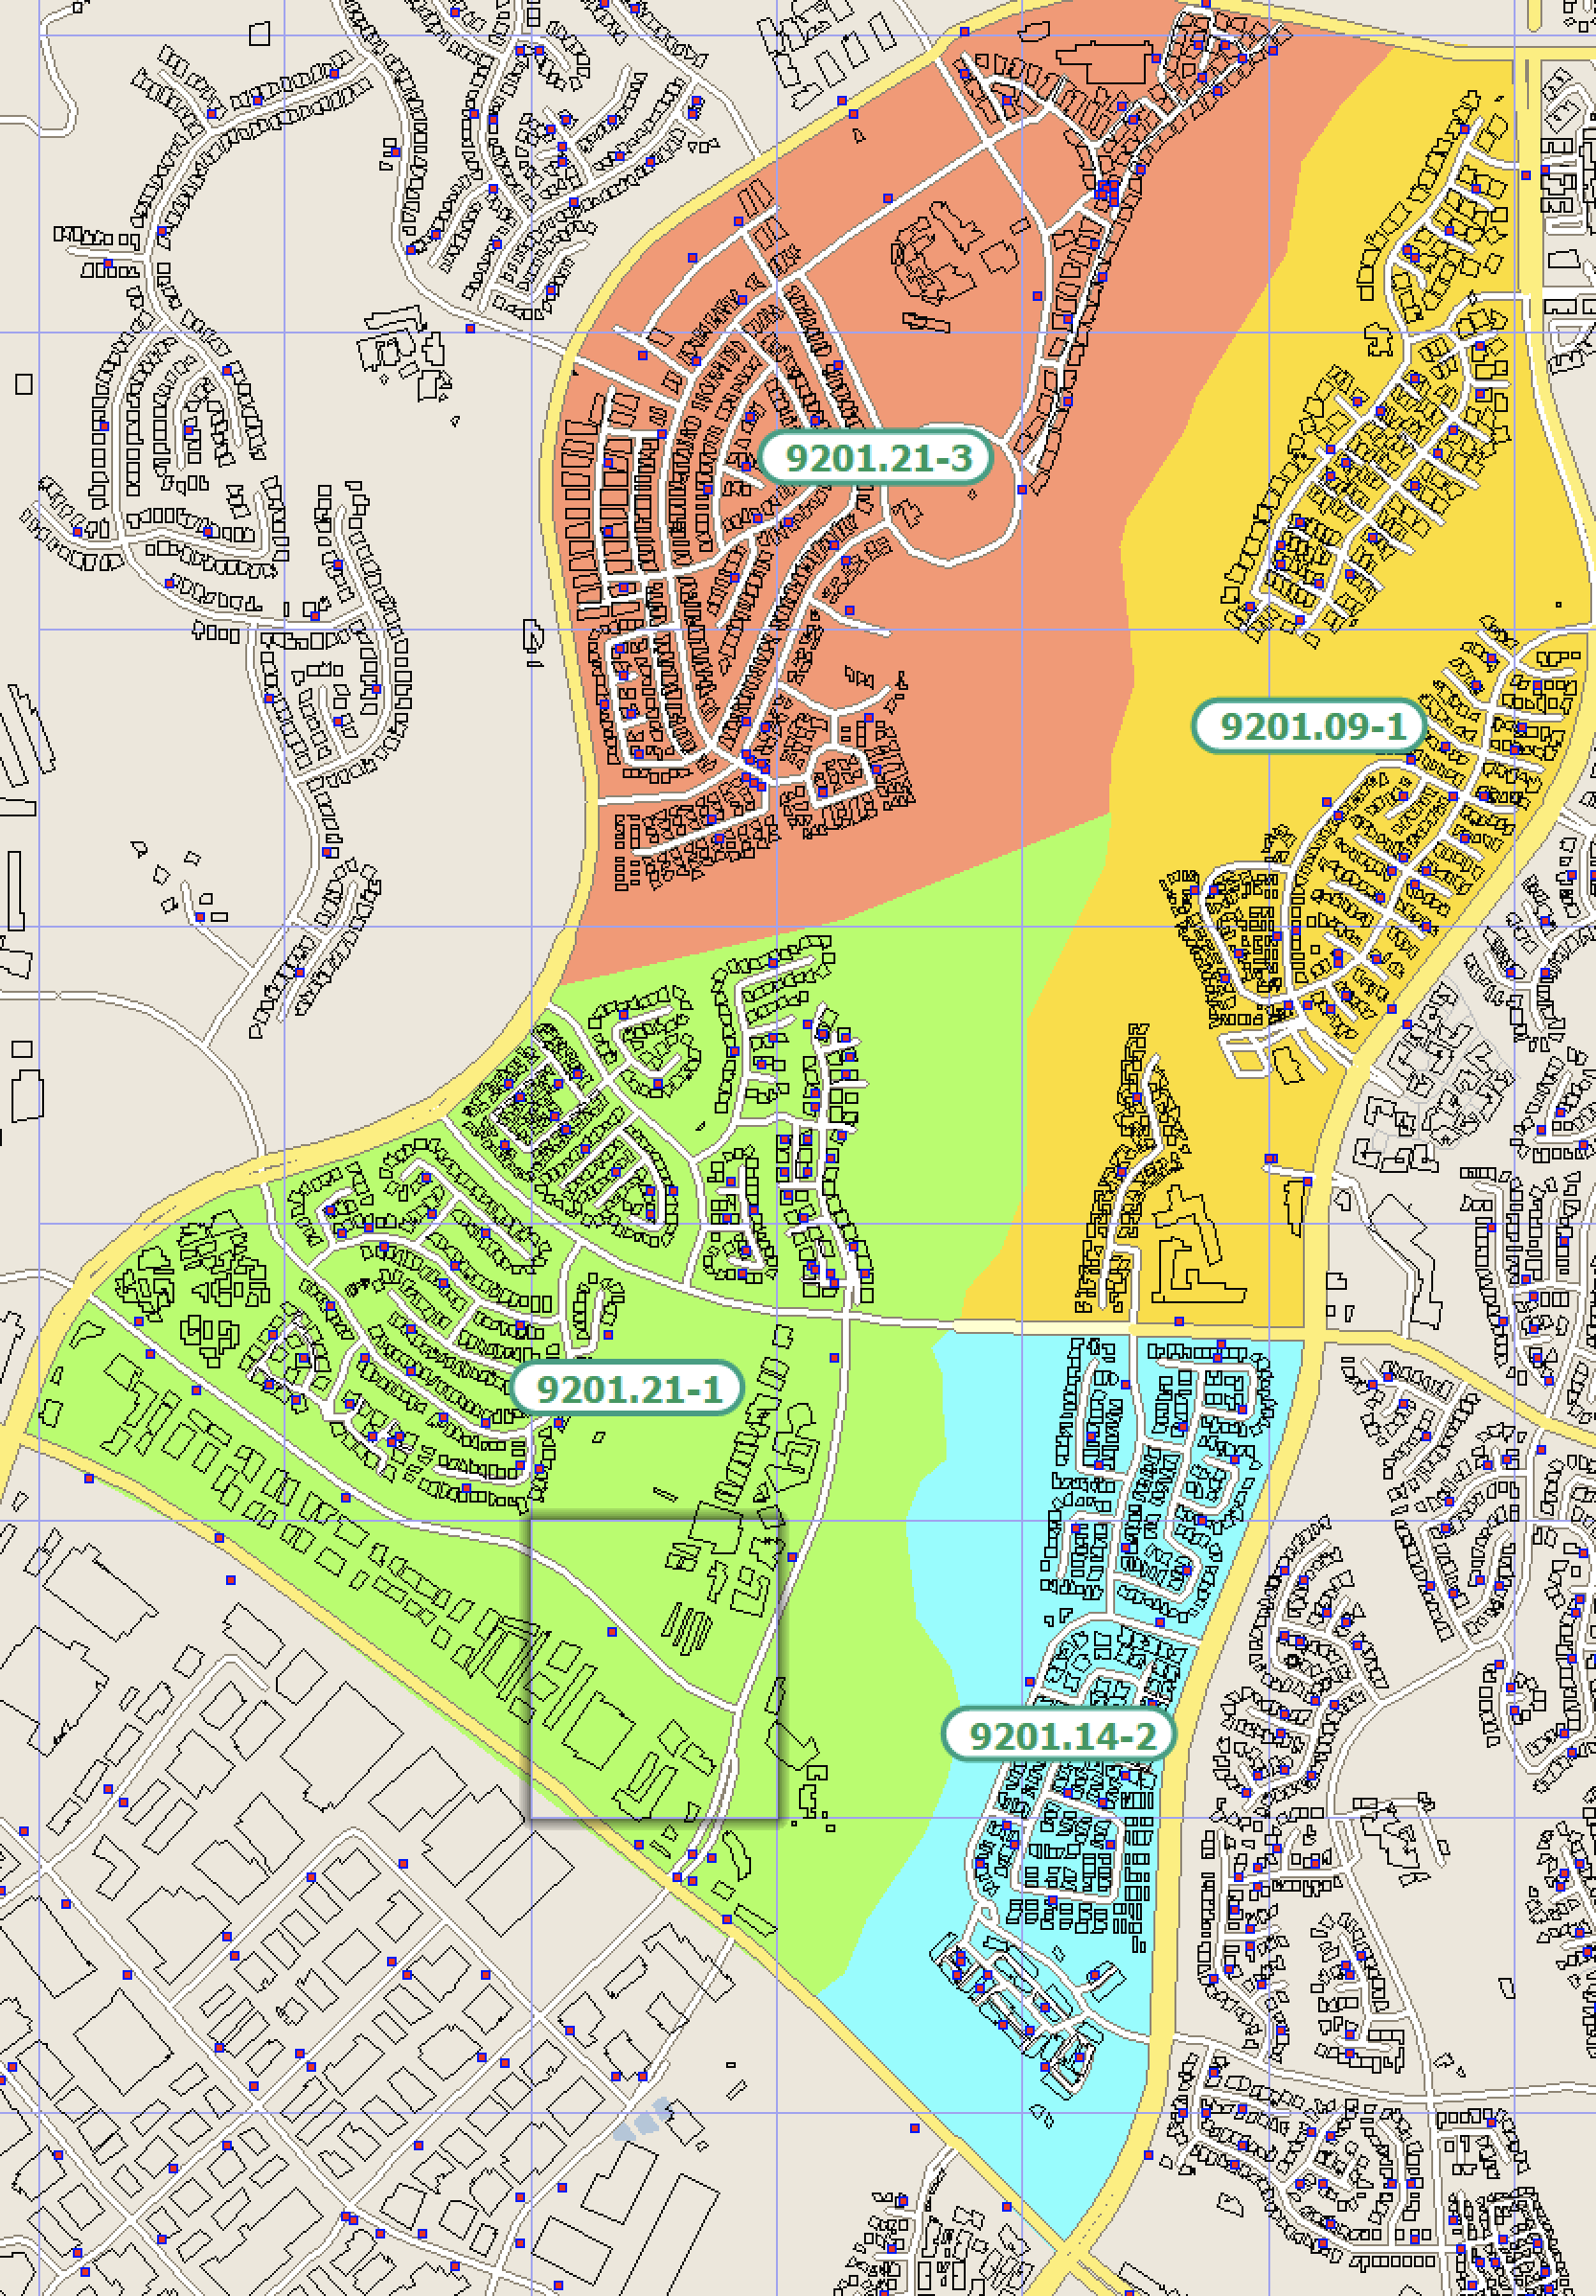
Now let's look at the grid at the bottom of the green-color blockgrounp. Something about the building footprints in this grid caught my eye.
Looking at the buildings in this newly built out area, one of the things you can see is the type and density of building footprint at the bottom of the green colored block group don't look residential.
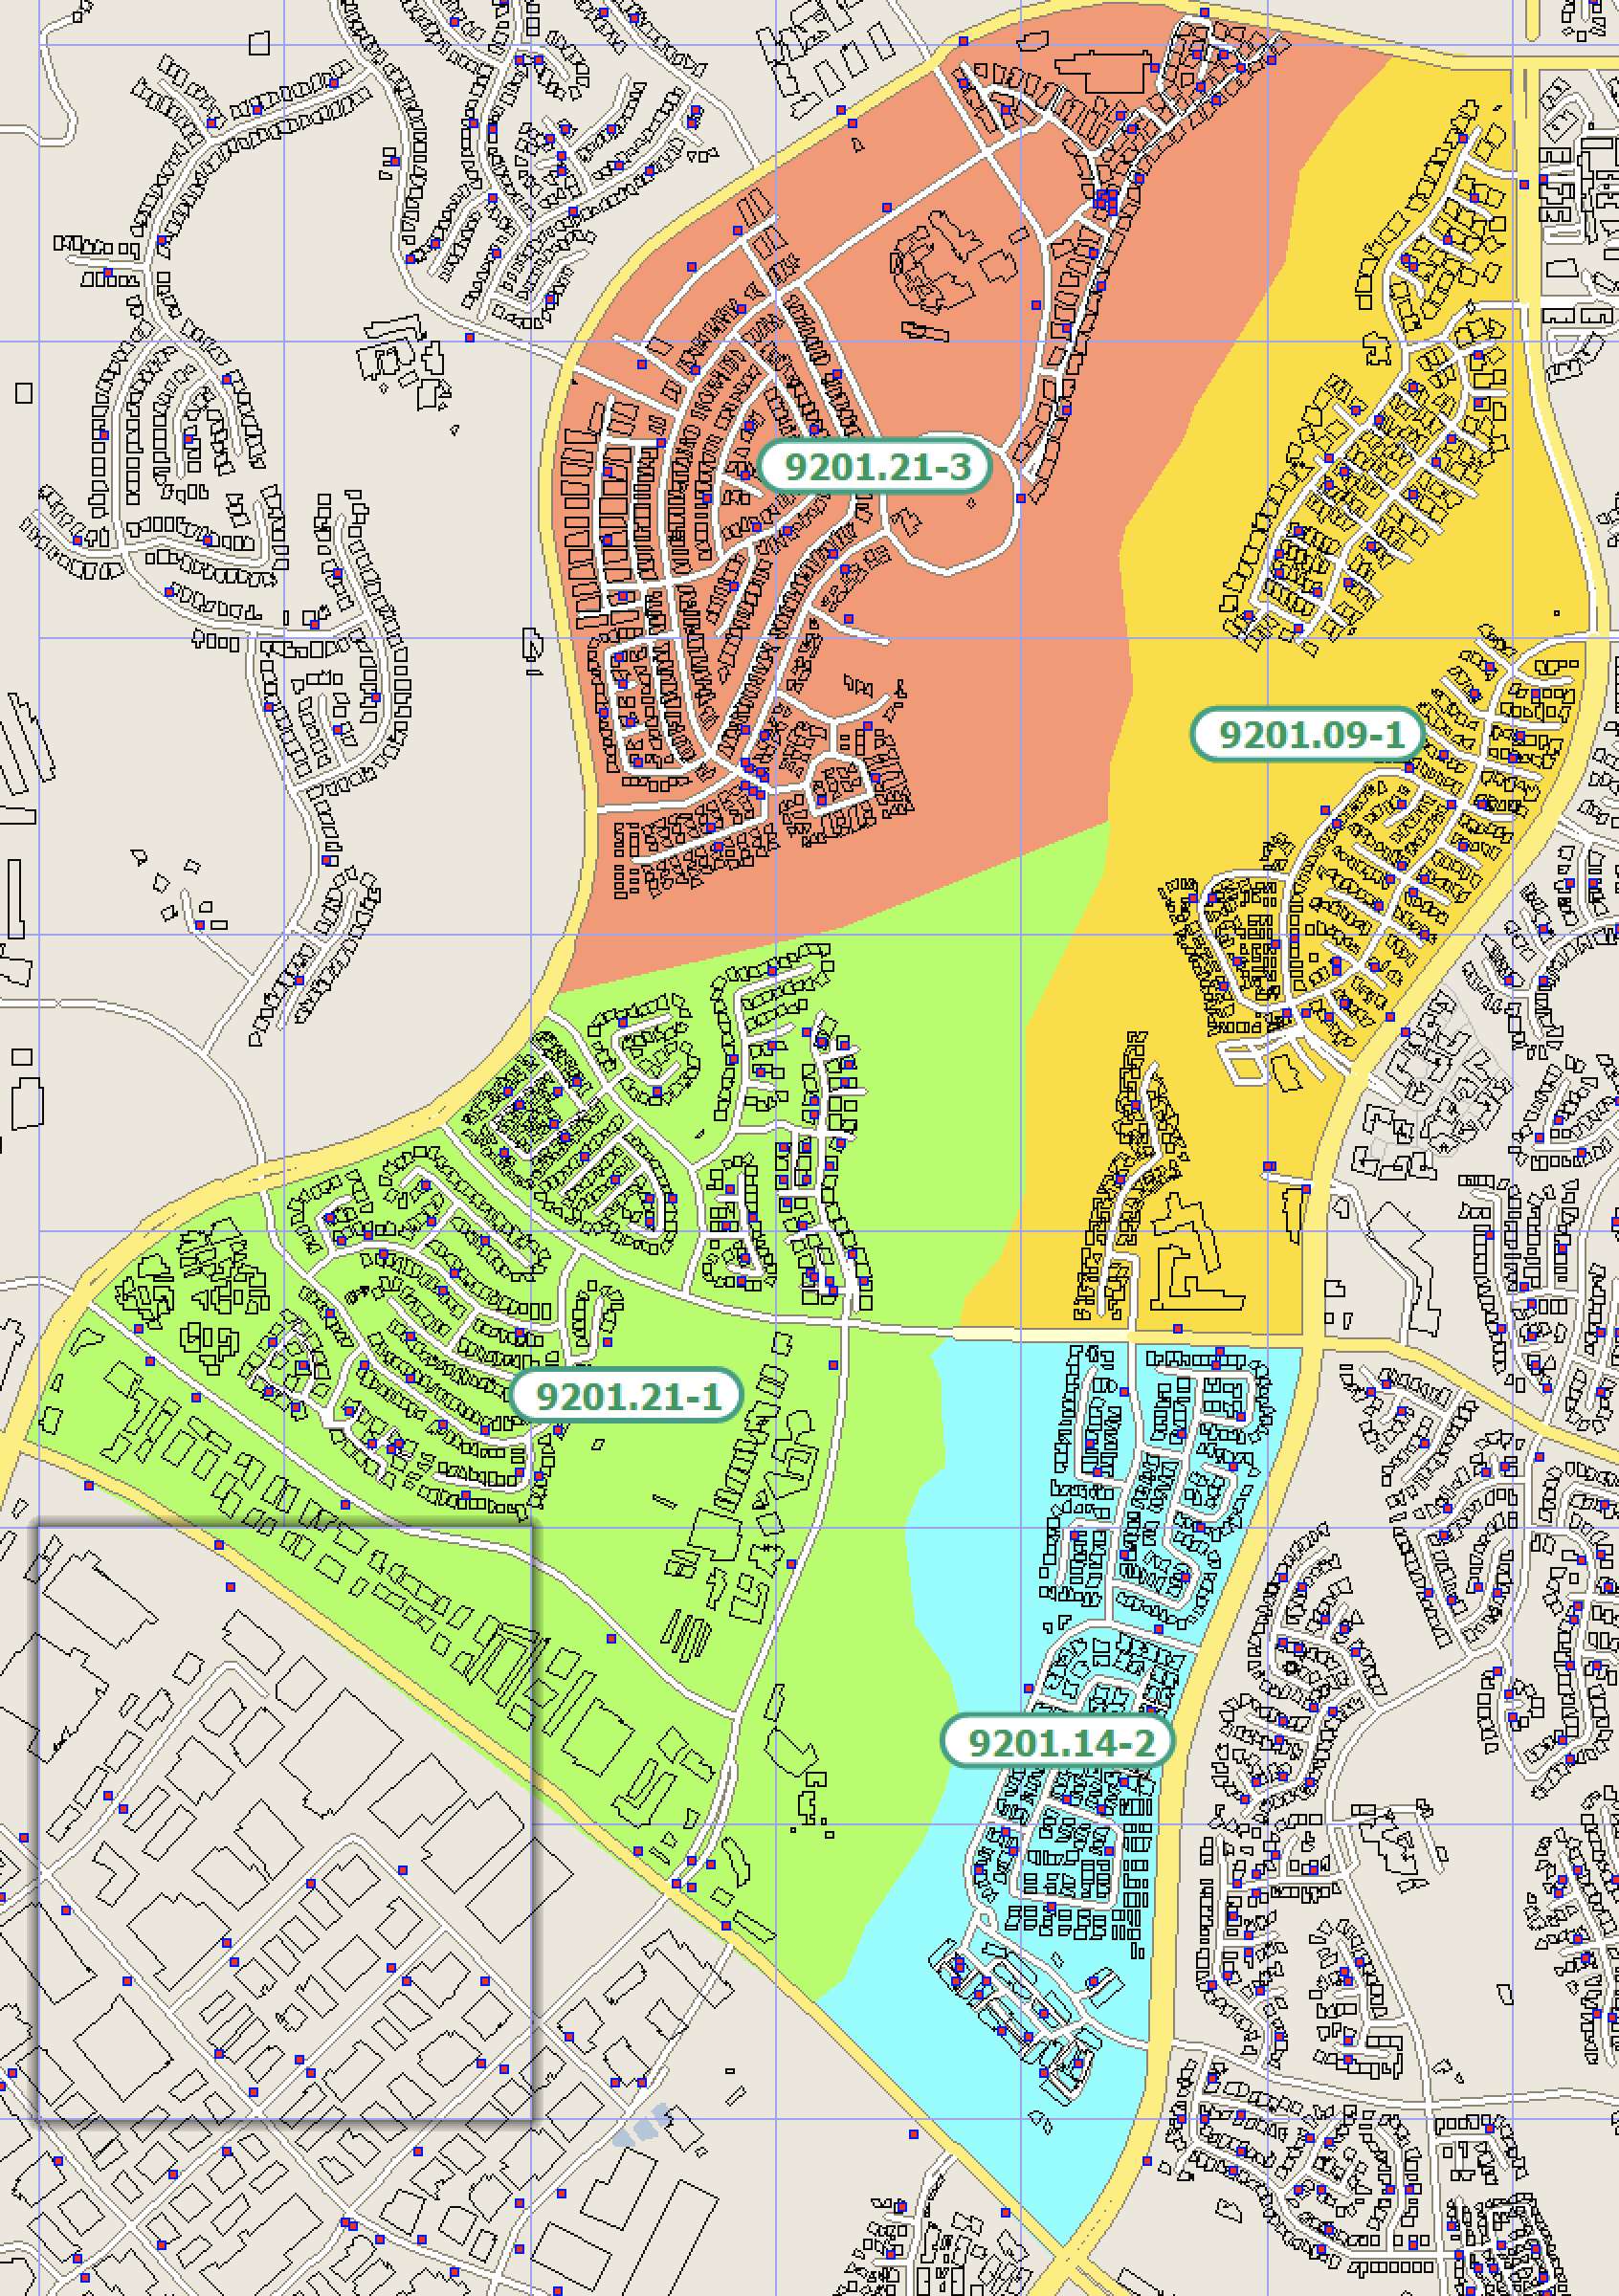
And if you look at the business summary totals (below), you can see that is true. It shows a count of businesses and employees consistent with a commercial zone
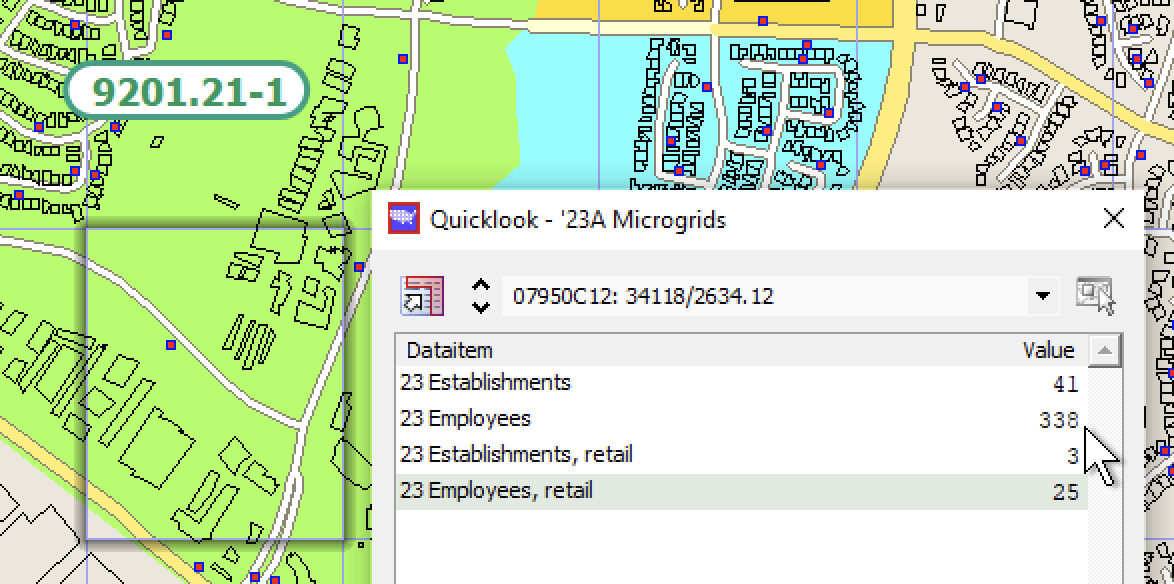
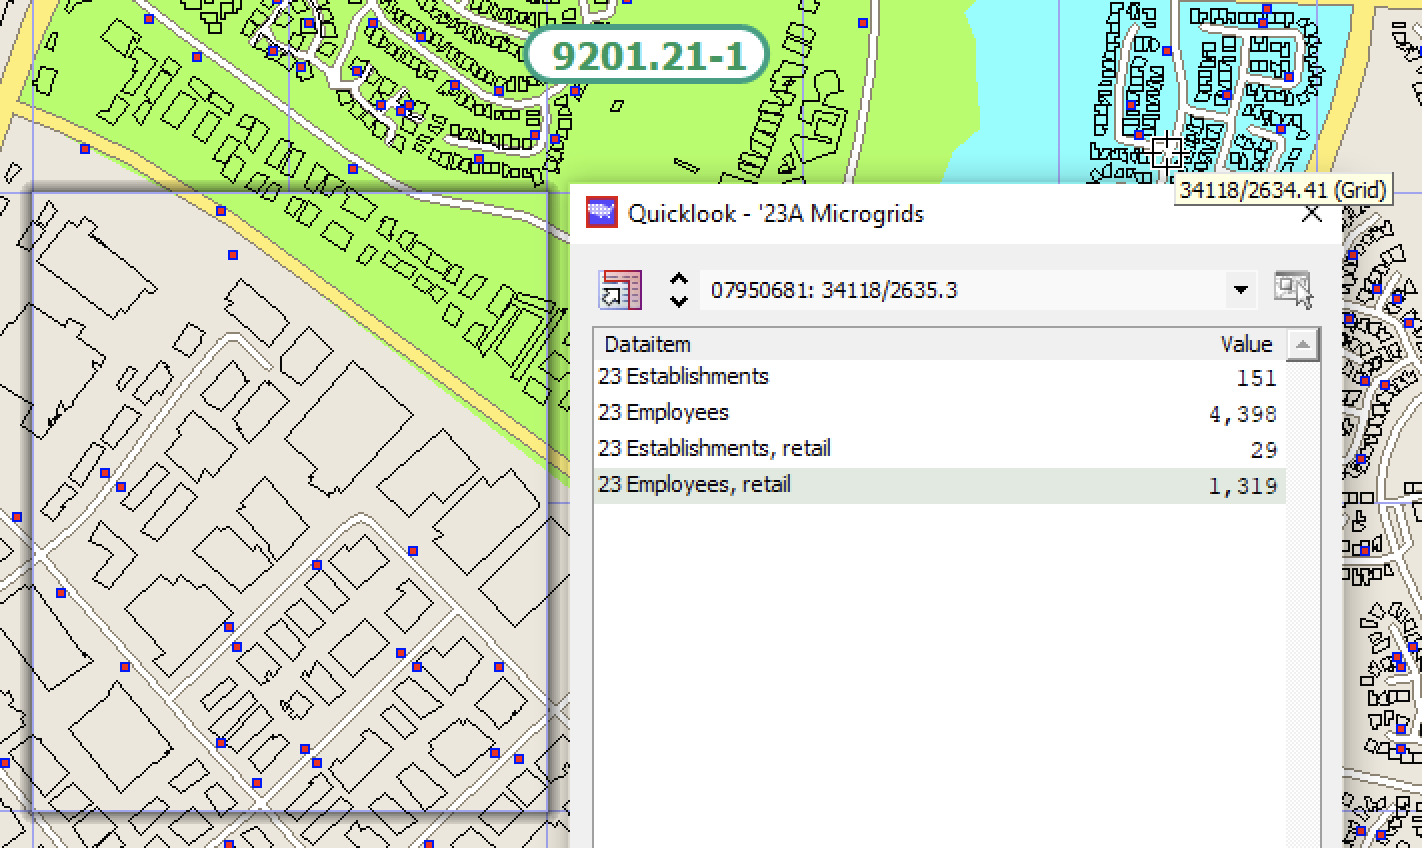
Quarter-minute grid
Finally, look at the large business park in the quarter-minute grid located largely below the green block group area. For this to be a residential pattern, one would expect more Zip + 4 point locations. This medium-size grid is appropriate to show low population density.
A quick look with Scan/US QuickLook (shown below) lets you see that over four thousand people work here, just under a third of them in retail. There are virtually no housing units or residents there.
Summary
Scan/US Microgrids are square grids on the map in three sizes, which hold population characteristics and demographic data for small areas. They cover only populated or built areas and make it possible for the software to calculate instant data summaries for rings, polygons, and drivetime contours.
The three sizes of Scan/US Microgrids are determined by household density in an area with nearly 3.4 million grids covering the United States. These grids are superior to Census Blockgroups for doing demographic analysis.
The advantages of Scan/US Microgrids include their ability to track residential growth accurately, provide precise demographic data, and support small area location-based decisions.
They are updated annually to reflect local changes in population and are better than the previous Census Blockgroups.
Additionally, the new algorithm used for Scan/US Microgrid creation optimalizes the grids' sizes, providing unprecedented fidelity in representing the location of population and business on the US landscape.
© 2010,2024 Scan/US, Inc. All rights reserved. No material in this document may be reproduced, in any form, without the express written consent of Scan/US, Inc. Contact us at (310) 828-1450. FAX (310) 453-6401. Or write to: Scan/US, Inc., 120 Stagecoach Road,
Bell Canyon, CA 91307. On the web, we can be found at www.scanus.com.
Scan/US and the Scan/US logo are registered trademarks of
Scan/US, Inc. Scan/US Microgrid(™) is a trademark of Scan/US, Inc.
Other company or product names used herein are for
identification purposes only and may be trademarks of their
respective companies. Any use of other company or product
names are for identification purposes only and does not
constitute an endorsement of the company or product by
Scan/US, Inc. Scan/US, Inc. is not responsible for any
problems and/or losses resulting from the use of any
product(s) mentioned in this document.
© 1992-2024 - Scan/US, Inc.